One of the factors of economic growth is the increase in the purchasing power of the country's citizens. On its basis, gross domestic product is calculated, demonstrating the economic well-being of people and the financial stability of enterprises. The indicator includes the monetary value of goods (services) that will be used by people. Changes in this indicator affect inflation. Macroeconomic research is important for the economy of any state. Based on these data, experts study the dynamics over certain periods and draw the following conclusions:
- about financial stability in the country;
- about the level of well-being of citizens.
What is a deflator?
A deflator is a statistical coefficient. It is necessary for the correct recalculation of financial indicators in monetary terms. The main task of the deflator is to bring current price indicators to specific prices of the past time period. In numerical terms, the deflator can be compared to the price increase index. That is, the deflator is an indicator demonstrating the value change in consumer and industrial goods. This is a statistical technique that smooths out the difference between the market price and the base price. The main indicators used for recalculation:
- GDP deflator (GDP);
- GNP deflator (DVNP).
GDP and its indices
Gross Domestic Product (GDP) is a macroeconomic indicator. It denotes the cost characteristics of goods created within the territorial boundaries of the country over a certain period of time. The GDP deflator is also called the indirect price deflator. It shows the ratio of the total price of a set of consumer goods (services) of a given year to the total cost of the same set in the base year. The indicator demonstrates how much the decrease or increase in GDP in basic prices of the year occurred due to changes in the price level in the economy.
When calculating the GDP deflator, two GDP indicators are used:
- nominal, corresponding to the current state of affairs;
- real, corresponding to the base period.
There are two ways of calculation:
- In the first, the agreed set of goods in the base prices of a particular year is taken as a basis. The numerator is equal to the cost of products produced during the base time period at current prices. The denominator is the indicator in base prices of the period. This is the Laisperes index.
- In the second case, the numerator is taken equal to the cost of goods of the current period, the denominator is the cost of products produced in the reporting time period in base prices. This is the Paasche index. It is similar to the Laisperes index, but applies to the current period.
Both indexes are imperfect. They are not able to show changes in the total price level. In this regard, the Fisher index can sometimes be used, which corrects shortcomings in the calculations and represents the geometric mean of the indices.
Therefore, the most accurate calculation of price level growth and inflation is demonstrated by the Fisher index.
- If the deflator exceeds one, then real GDP is less than nominal GDP, which means the real price level has increased, and inflation processes are observed (decrease in real incomes of the population and enterprises, depreciation of the money supply).
- If the deflator is less than one, then real GDP is greater than nominal GDP, which means the real price level has decreased, and deflationary processes are observed (increase in income).
- If the indicator is equal to one, then the process of stagnation in the economy is underway.
History of the index
The tool began to be used by economists relatively recently, when it became necessary to compare GDP indicators over several years. The problem was that the price structure changes greatly over time. With the advent of the coefficient, it became possible to compare GDP indicators for almost any period. In addition, there is a basis for comparing the economies of different countries.
For your information. The Federal State Statistics Service considers Russia's GDP both in current prices (for the reporting period) and in constant prices. The GDP deflator index demonstrates this relationship and makes it possible to assess how effectively the economy is developing. In addition, this tool is used to correctly compare Russia's macroeconomic results with similar international indicators. The use of these data to estimate and forecast GDP growth is the work of the Ministry of Economic Development.
To analyze price dynamics, the corresponding index was previously used - the CPI. But it only takes into account production and the cost of products within one country and for the current period (for example, for 2019 or for 2022). At the same time, the GDP deflator makes it possible to analyze how consumer preferences change in different countries and over any period of time.
Example. In 2022, many citizens began to use cheaper new products instead of more expensive familiar products. In the future, a drop in demand for goods in this category will lead to the manufacturer either reducing the price of its products or reducing the volume of its production. Conversely, the cost of new goods may rise sharply, and the planned volume will be adjusted upward.
Deflator and price index
The deflator should not be confused with the consumer price index (CPI):
- The GDP deflator is similar to the Paasche index. Data from the current period are taken as the basis for calculations.
- The CPI is calculated as the Laspeyres index. The calculation uses products of the base year.
- When calculating the CPI, only the prices of goods consumed by the country's population (consumer basket) are taken into account.
- When calculating the deflator, a collection of all goods (services) produced within the country is used. This set is modified depending on the adjustment of consumer preferences (citizens of the country). All new products used by consumers, or the appearance of completely unique new products (services) on the market, are taken into account by the deflator. It reflects the real consumer basket of the country's population, where all goods are included in a certain share of consumption at a specific market value (price).
- The cost of imported goods consumed by citizens is taken into account when calculating the CPI. When calculating the deflator, imports are not taken into account.
The difference between the deflator and the CPI is insignificant in numerical terms. The legislative authorities of many European countries, including the Russian Federation, use the price index in the annual economic planning of the country's budget (for example, calculating social benefit payments, settlements with budgetary organizations). Differences between the numerical values of GDP indicators affect budget revenues and government expenditures.
Deflator indices of the Ministry of Economic Development until 2030
So, as noted above, any deflator index is approved by the Russian Ministry of Economic Development. Indices and coefficients are predictive in nature and are provided for each year. Typically, deflators are developed with a view not only to the upcoming calendar year, but also to several years in advance. The forecast of deflator indices and inflation until 2030 of the Ministry of Economic Development will soon be available on the official website of the above-mentioned institution. In addition, the designated indices are printed and distributed by regional publications in the field of economics and pricing. For example, it is possible to clarify the deflator indices of the Ministry of Economic Development until 2022 in specialized printed publications and tables similar to the one in Figure 1.
Figure 1. Table of deflator indices
The forecast of deflator indices and coefficients is made on the basis of complex and voluminous data. This data is obtained from various sources: data on current prices for materials and equipment, GDP data, GNP data, data on citizens’ salaries. Basically, Rosstat data determines deflator indices and is statistical in nature. These indices are calculated in order to slow down inflation and deteriorate the level of the economy. In addition, these indices affect taxation and other economic processes.
It should also be noted that, as a rule, the Ministry of Economic Development provides an inflation forecast in three versions:
- The basic forecast is compiled in case the political, economic, social and other spheres in the country remain at the same level as at the time of forecasting.
- A favorable forecast is compiled in case there are trends towards improvement in the situation in all or in certain areas.
- The target forecast is calculated if the situation worsens at all or selected levels of the economy.
From which we can conclude that the calculation of the deflator index can be adjusted when generating estimate documentation.
Disadvantages of Indexes
The advantages of the deflator index include the fact that it takes into account:
- current prices of the current period;
- prices for imported goods consumed by the population;
- only the goods and services produced that are needed to calculate the gross product of a particular country.
The disadvantages of a deflator are as follows:
- The dynamics of real prices turns out to be too high when the deflator decreases, and when consumer prices increase, it turns out to be too low. The deflator cannot demonstrate an income effect when considering changes in consumer basket prices because it includes the Paasche index.
- It is also based on the Laisperes index, calculated on the basis of consumer prices. It does not delve into changes in the consumption basket due to price adjustments. It shows the income effect but does not take into account the substitution effect.
Deflator indices of the Ministry of Economic Development applied to the estimated cost.
Forecast deflator indices of the Ministry of Economic Development until 2030, as mentioned above, are the result of an analytical summary of many indicators and data. Of course, it is of great importance to take into account the fact that the forecast carries its share of errors, especially if they are compiled for a long time. Thus, it is obvious that using a deflator index in estimates for a facility whose construction is expected to take place over several years is quite risky. However, this is still economically justified and is a unique opportunity to eliminate possible losses associated with an increase in the price level for resources during the construction of the facility.
In addition, the introduction of deflator indices into the estimate forms for construction and installation work at the facility must be stipulated by the contract, since the execution of work during the construction of the facility and the delivery of KS-2, KS-3 will also be carried out taking into account the price index and index- deflator.
The most common mistakes
Calculating macroeconomic indicators is a complex, labor-intensive job, which is carried out by specialists at the Ministry of Economic Development of the Russian Federation. In private calculations, there are often shortcomings and miscalculations in the calculation of one or another index.
Since the GDP deflator is calculated as a ratio of GDP of different years, there are often common errors such as:
- Calculation of the index taking into account the cost of imported goods.
- Calculation of the index taking into account the replacement of expensive goods with more inexpensive ones. The substitution effect should not be taken into account.
How is the GDP deflator calculated: formula
There are two calculation options. In the first case, the GDP deflator is defined as the ratio of nominal (absolute) GDP, expressed in current prices, to real GDP, calculated in prices of the base period. The formula looks like this:
D = N / R x 100,
where D
,
N
and
P
are, respectively, the GDP deflator, as well as nominal and real GDP.
The second calculation option involves using the Paasche index in accordance with the following formula:
D = (Ʃ (OP x CPU) / Ʃ (OP x CB)) x 100,
where D
is the GDP deflator,
OP
is the volume of output for the reporting period,
CP
is the price of these products in the reporting period, and
CB
is the price of the base period.
In both calculations, the result is multiplied by 100 to give the final value as a percentage. If it is more than 100%, inflation has increased; if it is less, it has decreased.
The GDP deflator is calculated in all countries; these functions are assigned to national statistical authorities.
What does the deflator show?
The economic deflator is calculated by the Federal State Statistics Service. The deflator coefficient by year is subject to official publication on the website of the Ministry of Economic Development of the Russian Federation in the following order. The indicator values are published along with the calculation of gross domestic product and are duplicated three times:
- advance paynemt;
- viewing and analysis data;
- final data.
The index shows the level of inflation or deflation in relation to a certain calculation period. There are several indices that measure the depreciation of money:
- deflator;
- consumer prices.
Using special indicators, you can measure the inflation level (depreciation of the money supply), gain the opportunity to control and influence changes in the level of the current price currently operating on the market and the base price. The deflator shows this. Using the calculated data of the indicator, you can monitor and evaluate changes in profit or any other economic indicators.
Deflator coefficients
Every year, governments of different countries (the Russian Federation is no exception in this case) establish a certain special indicator called the “deflator coefficient”. Its main task is to change consumer prices for those products sold by suppliers that were most popular among consumers in a certain time period.
The deflator is an effective indicator, the value of which is expressed as the average change in the nominal value of industrial and popular products. Thanks to this statistical technique, you can easily adjust the difference between the total and real price. The adjustment process takes a minimum of time.
Calculating the real inflation rate is a problematic task. The problem is that the indicator is statistical in nature and includes unrelated (or even contradictory) factors. Let's say more: with a strong influence of the authorities on business, it is possible to change the level of inflation through forced setting of prices for goods and services. For objectivity of calculations, you can resort to the GDP deflator.
The GDP deflator is the ratio of nominal gross domestic product to real, that is, the actual gap between growth in production and prices. In a broader sense, the GDP deflator is a price indicator that shows the real change in prices over a certain period of time. For the calculation, real and nominal GDP indicators are used.
GDP directly depends on inflation and for actual growth it must outpace it. Real GDP is compared with the base period only in terms of value; nominal GDP also includes the rate of inflation or deflation.
When announcing GDP indicators, it is important to pay attention to the dynamics of changes in the deflator. If it grows, it means that real production lags behind the inflation rate. If it decreases, the observer is dealing with GDP growth or a decrease in inflation (possibly at the same time). The opposite scheme is possible in countries with a negative inflation rate.
When the GDP deflator grows, the trader is recommended to:
- pay attention to real sector enterprises (forming GDP);
- reduce investments in the currency of the issuing country;
- invest money in more stable currencies.
- When reducing the deflator, it is advisable to:
- invest in both the real and financial sectors;
- increase investments in the country's currency;
- invest in the production and sale of non-essential items.
| GDP deflator = | nominal GDP |
| real GDP |
Around the world, the GDP deflator is calculated by government statistics agencies or private companies. In Russia, this is the Federal State Statistics Service, which provides two types of Paasche formulas. The first of them is given just above; here the indicator is equal to the ratio of nominal GDP to real GDP.
| GDP deflator = | Ʃ (Qt * Pt) |
| Ʃ (Qt * P0) |
The second formula, more popular among economists (although not different in essence), is given next. Here:
Qt – production volume;
Pt – cost of goods and (without taking into account the inflation rate);
P0 – cost of goods and (taking into account inflation).
A number of economists are convinced that the GDP deflator cannot serve as a real indicator of inflation, since it does not include imported goods (this follows from the definition of GDP). They say that it is characterized by non-price manifestations, while the cost of goods and services is used in calculating the gross domestic product. There are often situations when a decrease in output is stimulating.
Another part believes that the GDP deflator is an indirect indicator of consumer satisfaction. An increase in the deflator leads to cheaper money, the economy has to “feed” it, and consumer activity falls. If the deflator has decreased, inflation has been curbed and citizens do not purchase goods due to market saturation. Ideally, this indicator should be equal to one.
The GNP deflator is a parameter that is calculated as the ratio of the nominal to the basic GNP parameter. The GNP deflator is expressed as a percentage and shows the price index for finished services and goods that are part of the gross national product. The calculated parameter is used to take into account the impact of inflation on the size of GNP.
Formula
The deflator calculation formula, when dividing nominal GDP (Nominal GDP) by the indicator (GDP deflator) and multiplying the result by one hundred, shows the indicator of real GDP (Real GDP). This process is called deflation of nominal GDP into real GDP. The GDP deflator is equal to:
Nominal gross domestic product is calculated using current year prices. Real GDP involves calculation using base year prices. If the obtained value is more than one hundred percent, then this indicates inflationary processes, and if it is less than one hundred percent, then, on the contrary, it indicates deflationary processes.
Publication of the indicator
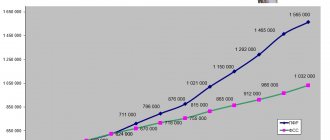
In the countries of the European Union, and even in the United States, statistics on this indicator are kept quarterly every year. This statistical method demonstrates the growth or decline of a country's gross product and signals the need for urgent government action to increase its growth.
| 2012 | 2013 | 2014 | 2015 | 2016 | 2017 |
| 109,1 | 105,4 | 107,5 | 108,0 | 103,2 | 105,5 |
The forecast for the deflator index according to the Federal Statistics Service of Russia in the current 2022 is only two percent. This is a rather low indicator of the country's economic development (the lowest over the past several years of development). To speed up the process, improved relations between the public and private sectors are required through:
- project refinancing;
- trade on-lending (replacement of one debt obligation with a new, different obligation on more favorable market conditions);
- mortgage lending secured by commercial real estate of legal entities.
The financial problems of the Russian Federation lie in the lack of investment in the real economy of the country, which is the locomotive for the growth of the state's gross domestic product.
To create conditions for attracting investments, you need:
- carrying out fundamental reforms in the sphere of government of the country (reduction of the state apparatus);
- carrying out privatization of objects in the real sector of the economy;
- transition to intensive economic growth (application of new modern innovative technologies);
- improvement of the country's credit, monetary and fiscal policies (tax reduction);
- support for private business at the state level;
- increasing high-productivity jobs;
- support for the demographic program.
Let us dwell on the state program that concerns the population of the country. It is aimed at:
- maintaining economic growth;
- reducing the level of poverty of citizens (now about a third of the population is below the poverty line);
- bringing the minimum wage to the level of the population's subsistence level;
- a decrease in the number of citizens with incomes below the minimum required for living.
In general, the program should have a beneficial effect on the growth of the state’s GDP. The program will be implemented through the following activities:
- increasing consumer demand;
- increased labor activity of women with children;
- support for the industries of heavy and light engineering, metallurgy, construction (including materials production).
Measures of state support for the Russian economy
For three years, the Russian Ministry of Economic Development has declared the implementation of the following goals:
- creation of an effective management system;
- development of a reliable environment for the development of private business;
- support for the country's domestic production (including exports);
- support for the development of innovative technologies;
- quality provision of public services;
- competent, targeted spending of budget funds (strengthening budget control) and management of state property;
- support for entrepreneurship (SMEs), including the creation of a non-bank depository and credit organization;
- promoting the country's interests on the world stage;
- development of civil society institutions.
The main threats to the Russian economy in 2022 are divided into external and internal.
External ones include:
- lack of developing financial relations with European countries;
- deterioration of the situation in the countries of the Middle East.
The internal ones include:
- reduction in consumer lending;
- decrease in retail turnover;
- reduction in business investment;
- reduction in development programs.
This year, economic growth in Russia may be limited:
- high level of unemployment;
- slight increase in labor efficiency;
- reduction in investments in fixed assets of enterprises against the backdrop of declining company income;
- low financial activity on the part of Russia’s partners on the world stage;
- reduction in borrowing for companies in the non-financial sector;
- reduction of investments for capitalization of enterprises;
- a slowdown in the growth of real incomes of the population and financing of private clients, as a consequence of a decrease in the growth rate of consumer demand, which is the main engine of economic growth.
A developmental contribution to the GDP growth rate this year can be made by:
- reduction in import purchases due to decreased domestic demand while maintaining export growth rates;
- investment support and workforce development;
- creating favorable conditions for investors to invest in the development of the country’s economy;
- government support for private business (reducing the fiscal burden, tariffs, placing government orders);
- development of innovative technologies in the field of logistics and trade.
The development of the investment environment is extremely necessary. Today, according to the Russian Ministry of Economic Development, it is necessary to inject about five trillion rubles into the country’s economy for further stable GDP growth.
Investment should be through:
- expansion of domestic and foreign markets for manufactured products;
- increasing export opportunities by reducing import opportunities;
- development of labor capital (improving the quality of higher and secondary education in the country, supporting young specialists, creating jobs within the country);
- increasing labor productivity.
The CPI is required to be published annually by the Russian State Statistics Service on the official website.
| Periods | For goods and services | For food products | For non-food items | For services |
| 2013 | 106,5 | 107,3 | 104,5 | 108,0 |
| 2014 | 111,4 | 105,4 | 108,1 | 110,5 |
| 2015 | 112,9 | 114,0 | 113,7 | 110,2 |
| 2016 | 105,4 | 104,6 | 105,6 | 104,9 |
Deflator indices for the next three years
| Industry | 2020 | 2020 | 2021 |
| Industry (BCDE) | |||
| deflator | 103,3 | 102,9 | 103,0 |
| PPI | 103,4 | 103,0 | 103,0 |
| including without fuel and energy complex products (oil, petroleum products, coal, gas, energy) | 104,1 | 104,1 | 103,9 |
| Mining (Section B) | |||
| deflator | 101,2 | 100,6 | 101,0 |
| PPI | 101,4 | 101,2 | 101,1 |
| Extraction of fuel and energy minerals (05, 06+09) | |||
| deflator | 100,9 | 100,4 | 100,8 |
| PPI | 101,2 | 101,0 | 100,9 |
| Coal mining (05) | |||
| deflator | 104,5 | 104,0 | 103,7 |
| PPI | 104,3 | 104,1 | 103,9 |
| thermal coal | |||
| PPI | 104,6 | 104,1 | 104,1 |
| Crude oil and natural gas production (06+09) | |||
| deflator | 100,5 | 100,0 | 100,4 |
| PPI | 100,8 | 100,7 | 100,6 |
| Mining of metal ores and other minerals (07, 08) | |||
| deflator | 104,0 | 102,6 | 102,9 |
| PPI | 103,6 | 103,0 | 103,0 |
| Metal ore mining (07) | |||
| deflator | 104,2 | 102,5 | 102,7 |
| producer price index | 103,7 | 102,8 | 102,9 |
| Mining of other minerals (08) | |||
| deflator | 103,2 | 103,3 | 103,3 |
| PPI | 103,1 | 103,2 | 103,2 |
| Manufacturing (Section C) | |||
| deflator | 103,9 | 103,5 | 103,5 |
| PPI | 103,7 | 103,5 | 103,4 |
| Production of food products, beverages and tobacco products (10, 11, 12) | |||
| deflator | 103,1 | 103,2 | 103,5 |
| PPI | 102,9 | 103,2 | 103,4 |
| Textile production, clothing production, leather and leather goods production (13, 14, 15) | |||
| deflator | 104,2 | 103,8 | 103,5 |
| PPI | 104,1 | 103,8 | 103,6 |
| Wood processing and production of wood and cork products, except furniture, production of straw products and wicker materials (16) | |||
| deflator | 105,1 | 104,6 | 104,3 |
| PPI | 104,6 | 104,4 | 104,3 |
| Production of paper and paper products (17) | |||
| deflator | 105,2 | 104,7 | 104,4 |
| PPI | 104,7 | 104,5 | 104,3 |
| Production of petroleum products (19.2) | |||
| deflator | 101,3 | 100,1 | 100,6 |
| PPI | 100,9 | 99,8 | 100,3 |
| Production of chemicals and chemical products, production of medicines and materials used for medical purposes, production of rubber and plastic products (20, 21, 22) | |||
| deflator | 105,2 | 104,9 | 104,7 |
| PPI | 104,8 | 104,7 | 104,5 |
| Production of other non-metallic mineral products (23) | |||
| deflator | 103,9 | 103,7 | 103,6 |
| PPI | 103,9 | 103,8 | 103,7 |
| Ferrous metal production (24.1, 24.2, 24.3, 24.5) | |||
| deflator | 104,2 | 104,7 | 103,7 |
| PPI | 103,8 | 104,4 | 103,1 |
| Production of basic precious metals and other non-ferrous metals, production of nuclear fuel (24.4) | |||
| deflator | 106,0 | 104,5 | 104,1 |
| PPI | 105,6 | 104,3 | 103,7 |
| Production of finished metal products, except machinery and equipment (25) | |||
| deflator | 104,5 | 104,5 | 104,2 |
| PPI | 104,3 | 104,3 | 104,1 |
| Mechanical engineering products (26, 27, 28, 29, 30, 33) | |||
| deflator | 105,5 | 105,3 | 105,4 |
| PPI | 105,3 | 105,1 | 105,1 |
| Others | |||
| deflator | 102,8 | 102,9 | 103,2 |
| Providing electricity, gas and steam; air conditioning (35) | |||
| deflator | 105,0 | 104,2 | 104,0 |
| producer price index (PPI) | 105,0 | 104,2 | 104,0 |
| Water supply; water disposal, organization of waste collection and disposal, pollution control activities (Section E) | |||
| deflator | 104,0 | 104,0 | 104,0 |
| PPI | 104,0 | 104,0 | 104,0 |
| Agriculture | |||
| deflator | 103,5 | 103,1 | 103,3 |
| Producer price indices | |||
| Crop production | |||
| deflator | 103,7 | 102,9 | 102,9 |
| Livestock | |||
| deflator | 103,4 | 103,5 | 103,7 |
| price index for sales of products by agricultural producers | 103,5 | 103,8 | 103,9 |
| Transport incl. pipeline | |||
| deflator | 104,3 | 104,2 | 104,1 |
| PPI | 104,4 | 104,3 | 104,3 |
| PPI with the exception of pipelines. transport | 103,6 | 103,7 | 103,6 |
| Investments in fixed assets (capital investments) | |||
| deflator | 105,0 | 104,4 | 104,2 |
| price indices | |||
| Construction | |||
| deflator | 105,0 | 104,8 | 104,5 |
| PPI | 104,7 | 104,6 | 104,5 |
| Consumer market | |||
| retail trade turnover, deflator | 104,2 | 103,5 | 104,0 |
| CPI for goods | 104,0 | 103,3 | 103,9 |
| paid services to the population, deflator | 104,8 | 104,2 | 104,3 |
| CPI for services | 104,9 | 104,3 | 104,4 |
Economic sense
The Ministry of Economic Development of the country uses the deflator as an indirect price indicator to calculate the cost characteristics of products and services of a particular state for a certain time period.
When expecting an increase in this indicator, the following occurs:
- significant increase in the exchange rate;
- a significant increase in interest rates on placement and attraction of borrowed funds.
We can say with complete confidence that the deflator index influences the domestic and foreign exchange markets of the country.
Areas of application
Next, officials determine what prices will be in future periods. Having received the cost positions, the level of income of the population is assessed. Moreover, the analysis is carried out for each category of citizens separately. Calculations are carried out taking into account the needs of the adult working population, minor Russians and, of course, pensioners.
These indicators allow us to forecast the need for indexation of benefits, pension payments and other social supplements. All operations are carried out taking into account the deflator index - annual indexation of benefits at the expense of the Social Insurance Fund (usually carried out in January-February), indexation of pensions, increasing the value of pension points, increasing social compensation, additional payments and allowances.
Note that social policy is not the only area of application of coefficients. For example, the deflator index for 2022 in construction allows you to determine price indicators for building materials, services and work. But this is just the tip of the iceberg. The cost of finished housing and other real estate ultimately depends on these calculations.
The deflator index for 2022 for estimates has a similar meaning. This coefficient makes it possible to predict the level of government procurement and determine the need and solvency of Russian organizations in the planning period. For example, a company, when planning the purchase of goods, works, and services, is obliged to take into account not only the completed amounts of financing and its needs, but also the dynamics of prices for the necessary goods, works, and services.
Let us note that none of the spheres of state activity can do without the use of deflator indices. Even the tax system contains calculations based on the application of these coefficients.