Assets and liabilities in the balance sheet
The preparation of financial accounting statements is the direct responsibility of all economic entities conducting accounting.
Some companies and organizations are entitled to keep records in a simplified form, and some are completely exempt. For example, individual entrepreneurs have the right to refuse accounting altogether. But if the enterprise maintains accounting, then reporting becomes inevitable. Reporting is necessary to obtain up-to-date information about the activities, property status and obligations of the entity. Analysis of the information received allows you to quickly and timely make the right management decisions, thereby allowing the enterprise to function smoothly, make a profit, and perform the functions and powers for which it was created.
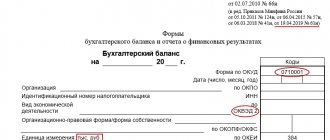
In essence, reporting is a reflection of property and capital, as well as the sources from which they were obtained, only in monetary terms. The key form of financial reporting is the balance sheet, the unified form of which is approved by Order of the Ministry of Finance No. 66n. For public sector institutions, other forms of reports apply: Orders of the Ministry of Finance No. 33n and 191n. However, regardless of the type of organization, the structure of the balance sheet is practically the same, that is, the forms include the assets and liabilities of the balance sheet.
What is the difference between current assets and non-current assets?
Let's take a closer look at the differences between current assets and non-current assets:
- Maturity. VAs are long-term. They can be used from 1 year until they are written off. OA is short-term. Their turnover is only 1-2 cycles.
- Liquidity. VAs are mostly illiquid. This is due to their long lifespan. If you try to convert them into money after use, you are unlikely to get a large amount (with the exception of real estate). OA is liquid (especially money).
- Depreciation. VA is often overrated. This is due to a decrease in their price as they wear out, despite the increase in product costs. This phenomenon is called asset depreciation. It is unique to VA.
- Recoil. VA transfer their cost of manufactured products in parts, OA – in full.
- Lending. VAs need long-term investment, so they are usually purchased at the expense of OS. OA quickly pays for itself. For companies whose capital structure is dominated by the latter, it is much easier to attract loans.
- Location in financial documents. VA are reflected in section 1 of the Balance Sheet, OA – in the second.
- Specificity. The presence of one or another group of assets may be determined by the specialization of the company. A high share of VA is present in capital-intensive companies (for example, telecommunications). Trading enterprises and material-intensive industries have large reserves of OA.
In order to ease the tax burden for some types of enterprises, the state introduced a simplified taxation system. Simplified taxation system for LLCs: pros and cons, tax rates and objects of taxation, read carefully.
We will consider the types of piecework wages in this article.
What is included in the active part of the balance sheet
This is any property of the institution. For example, cash on hand, inventories, fixed assets, buildings, machines and other material and financial assets that directly belong to the company.
The assets of the balance sheet group the current and non-current assets of the enterprise. When preparing reports, it should be taken into account that a balance sheet asset is a grouping of assets according to their useful life, as well as according to the speed (time) of their turnover, that is, liquidity.
In the form of a balance sheet, assets are grouped according to their degree of liquidity. The resources of the enterprise that are the least liquid are indicated first, and then in ascending order. In other words, a balance sheet asset is a grouping of economic resources according to the speed of their circulation into means of payment.
Let us note that the most liquid assets are, of course, cash: cash in the cash register and in the company’s current accounts. And the least liquid include the institution’s fixed assets, intangible assets and long-term financial investments, which cannot be realized quickly and without losses.
The assets of the balance sheet present in grouped form the accounting indicators as of the reporting date. Analysis of these accounting indicators allows us to draw a conclusion about the solvency of the enterprise.
What does the ratio of current and non-current assets show?
To determine the level of financial stability of an enterprise, interested users of accounting can calculate the ratio of current and non-current assets using the corresponding lines of the balance sheet using the formula:
K = OA (p. 1200) / VA (p. 1100),
Where:
K—asset ratio;
OA (line 1200) - current assets;
VA (p. 1100) - non-current assets.
By calculating the ratio of current and non-current assets, the company will be able to determine its level of provision with resources and property, as well as the volume of non-current assets, which accounts for 1 ruble of current assets.
About the importance of analysis of current assets - in the article “Current assets of an enterprise and their indicators (analysis)”.
What are liabilities and their classification in the balance sheet
Balance sheet liabilities include all the obligations of the organization that were accepted by it in the reporting period, as well as the sources of the formation of material assets and resources of the institution. In other words, the liability side of the balance sheet is a grouping of assets according to the sources of their formation, that is, liabilities are the sources of formation of material assets, cash, and intangible assets.
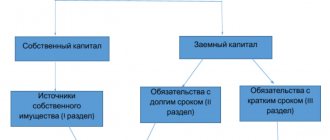
The main classification of balance sheet liabilities is the division of liabilities into capital and liabilities.
Capital is recognized as funds allocated by the founders to carry out activities, for example, to purchase property, to provide guarantees to creditors, and to create reserve funds. Liability capital can be own or borrowed. Own funds are capital that belongs to the founders, the creators of the company. And borrowed capital liabilities are funds received from third-party organizations and individuals for temporary use.
Balance sheet liabilities are the company's debt to third parties to fulfill certain financial or property requirements. In turn, liabilities are divided into long-term (more than 12 months) and short-term debts, which must be fulfilled 12 months or earlier.
Current assets include the following components
Let's look at the diagram to see what the company's current assets are.
From 01/01/2021, inventory accounting is regulated by the new FSBU 5/2019 “Inventories” (approved by Order of the Ministry of Finance dated 11/15/2019 No. 180n), PBU 5/01 has become invalid. Some accounting rules have been changed significantly. An analytical review from ConsultantPlus will help you learn about changes in inventory accounting. Get trial access to K+ for free and proceed to the material.
Rules for drawing up a balance sheet
Let's look at what accounting indicators should be reflected in the active part of the balance sheet. Here is a breakdown of the accounts and indicators of the reporting form:
| Structure | What to include |
| I. NON-CURRENT | |
| Intangible assets | The residual value of the enterprise's intangible assets should be reflected here. Determine the value as the difference between account 04 “Intangible assets” and 05 “Depreciation of intangible assets”. When calculating, exclude values corresponding to data on the results of research and development, as well as information on intangible exploration assets. |
| Research and development results | If an organization conducts research activities and the results of R&D are listed on the balance sheet, then in this section of the balance sheet reflect the residual value of R&D in account 04. |
| Intangible search assets | Filled out by organizations that conduct natural resource development and exploration activities. Economic entities reflect information about such objects on account 08. If an object has a tangible-material shell, then it is a material search asset, intangible ones - without a form, shell, or structure. Please note that for search assets, depreciation is calculated on accounts 02 and 05. |
| Material prospecting assets | |
| Fixed assets | Residual value of fixed assets. Determine the difference between the initial cost of account 01 and accrued depreciation, the balance of account 02. |
| Profitable investments in material assets | Reflect the difference between the balances on account 03 and the accrued depreciation for the corresponding accounting objects (account 02). |
| Financial investments | These are long-term financial investments with a maturity of at least 12 months. For example, reflect the account balance 55 if there are deposits opened for a period of more than 12 months. Also reflect long-term investments in accounts 58 (financial investments) and 73 (loans to employees of the institution). Reduce the balance on account 58 if the organization has created a reserve for the account. 59. |
| Deferred tax assets | Reflect the account balance. 09. Indicators are reflected in accordance with PBU 18/02. |
| Other noncurrent assets | Reflect other types of non-current assets that are not included in the group presented above. Also in this section you can reflect those objects about which it is not necessary to indicate information, but the company considers it necessary to include information in the balance sheet. |
| Total for Section I | The total for the corresponding section is generated. |
| II. NEGOTIABLE | |
| Reserves | Reflect the amount of balances on accounts 10, 11 (minus the reserve recorded on account 14), 15, 16, 20, 21, 23, 28, 29, 41 (minus account 42, if goods are recorded with a markup), 43, 44, 45, 46, 97. |
| Value added tax on purchased assets | Include information about the ending account balance. 19 "VAT". |
| Accounts receivable | To obtain the indicator, debit balances on accounts 60, 62 (both accounts minus the reserves formed on account 63), 66, 67, 68, 69, 70, 71, 73 (minus the data recorded under the item “Financial investments”) are summed up. , 75, 76. Do not include the credit balance in the calculation. |
| Financial investments (excluding cash equivalents) | These are deposits, financial investments, loans to employees with a maturity of less than 12 months. We form account balances. 55, 58, 73. We take into account the reserve on the account. 59, we subtract it if there is a balance. |
| Cash and cash equivalents | The actual money of the company listed in accounts 50, 51, 55 (except for the deposit), 52, 57 as of the reporting date. We reflect the amount of the debit balance. |
| Other current assets | Reflect other types of current assets that are not included in the group presented above. Also in this section you can reflect those objects about which it is not necessary to indicate information, but the company considers it necessary to include information in the balance sheet. |
| Total for Section II | The total value of the section indicators. |
| BALANCE | Sum of section 1 and 2. |
Analysis of the ratio of assets and its impact on the activities of the enterprise
There is no ideal formula for the ratio of current and non-current assets. However, there are standard approaches to analyzing the dynamics of the ratio coefficient.
An increase in the share of current assets (growth of the ratio) indicates:
- An increase in inventories of raw materials and materials, which is a positive factor if production has increased. Otherwise, this may indicate ineffective planning.
- An increase in the volume of finished products, which may indicate ineffective work of the divisions responsible for sales.
- An increase in the amount of accounts receivable. This is rather a negative point, as it inevitably leads to an increase in overdue and bad debts.
- Growth of short-term financial investments. Increases financial stability. However, it requires effective control to prevent a situation where investment is carried out to the detriment of the company’s core activities.
- An increase in cash balances in the company's accounts. In general, the factor is positive, since it increases financial stability. However, an excess of free money may indicate ineffective planning.
- Reducing the volume of non-current assets. This can be either a positive factor if, for example, the company gets rid of non-core assets, or negative if the company loses its fixed assets as a result of an accident, natural disaster or for other reasons.
A decrease in the coefficient value may indicate:
- A reduction in production volumes due to both a general deterioration in economic conditions and the emergence of systemic problems at a particular enterprise.
- Decrease in cash balances in the company's accounts. An alarm signal indicating a deterioration in the financial situation.
- Growth in the valuation of fixed assets. A positive factor if such dynamics were the result of expanding the scale of the enterprise’s activities: acquiring new production facilities, introducing scientific developments, registering trademarks, etc. But it also happens that a company increases the volume of non-current assets without the necessary analysis and planning. In this case, the result will only be an increase in non-production costs and a decrease in profits.
In general, other things being equal, an increase in the ratio of current and non-current assets indicates an expansion of the scale of the enterprise’s activities and an increase in its financial stability. This has a positive effect on the investment attractiveness of the company. If the value of the coefficient has decreased, management needs to conduct a thorough analysis of the reasons in order to make the necessary management decisions in a timely manner.
How to correctly prepare a balance sheet liability
Let's present the information in a table.
| Passive | What to include in the liability lines of the balance sheet |
| III. CAPITAL AND RESERVES 6 | |
| Authorized capital (share capital, authorized capital, contributions of partners) | The liability line is formed as information on the credit of account 80. |
| Own shares purchased from shareholders | Reflected based on the amount of account 81 balances formed as of the reporting date. |
| Revaluation of non-current assets | Information is reflected if, during the reporting period, the organization carried out a revaluation of fixed assets and intangible assets. The account balance is formed. 83. |
| Additional capital (without revaluation) | When forming additional capital, the company reflects information on account balances 83. Please note that the amount is indicated without taking into account the revaluation of fixed assets and intangible assets. |
| Reserve capital | In the liability line of the balance sheet, include the balance of account 82 at the end of the reporting period. Reflects information about the formed reserve capital for the organization. |
| Retained earnings (uncovered loss) | When generating the liabilities of the annual balance sheet, use the data from account balance 84. When generating interim reporting, this figure is two account balances 84 (financial result of previous years) and 99 (financial result of the current period of the reporting year). Please note that if the result is a loss, the amount is reflected with a minus. |
| Total for Section III | The total value for the corresponding liability section of the balance sheet. |
| IV. LONG TERM DUTIES | Liability obligations whose maturity exceeds 12 months. |
| Borrowed funds | We reflect the balance of account 67 in the liability side of the balance sheet if the liability period exceeds one year. Please note that interest on loans must be included in the current liabilities section. |
| Deferred tax liabilities | It is an indicator of account balance 77, filled out based on the provisions of PBU 18/02. |
| Estimated liabilities | We reflect the balance of account 96 “Reserves for future expenses” for a period of more than one year. |
| Other obligations | In this line, disclose information about other types of long-term liabilities that were not detailed in other lines of the balance sheet. |
| Total for Section IV | Summarizes the section row metrics. |
| V. SHORT-TERM LIABILITIES | Liability obligations with a duration of less than 12 months. |
| Borrowed funds | The balance of account 66 is reflected. In this case, interest paid on long-term loans should be included in this liability line of the balance sheet. |
| Accounts payable | The indicator is formed as the sum of credit balances for accounts 60, 62, 68, 69, 70, 71, 73, 75, 76. |
| revenue of the future periods | The indicator is equal to the sum of account balances 86 (targeted funding received) and 98 (deferred income). |
| Estimated liabilities | Create a balance on account 96 (reserves for future expenses) for those reserves whose use period is less than 12 months. |
| Other obligations | Here, decipher short-term liabilities that are not included in other liability lines of the balance sheet. |
| Total for Section V | Sum of rows by section. |
| BALANCE | The total value for the liability sections of the balance sheet. |
IMPORTANT!
The values of assets and liabilities are always reflected in monetary terms. Moreover, transactions are recorded exclusively in rubles. If settlements are made in foreign currency, then the transaction must be converted into rubles. The exchange rate approved by the Central Bank of Russia at the time of the economic activity is used.
The balance sheet and other financial statements are prepared in rubles or thousands of rubles. If the company’s turnover is significant, then it is permissible to indicate the amounts in the balance sheet in millions of rubles.
Composition and structure of current assets
| Indicators | Line code according to book. balance | Amount, thousand rubles | Change over the year, (+, -) | Rate of change, % | Share in the current assets of the enterprise, % | ||||
| for the beginning of the year | at the end of the year | for the beginning of the year | at the end of the year | ||||||
| Current (current) assets, Total | 19 430 | 25 213 | +5 783 | +29,76 | 100,00 | 100,00 | |||
| including: stocks | 10 441 | 8 677 | -1 764 | -16,89 | 53,74 | 34,41 | |||
| of them: | |||||||||
| raw materials | 1 937 | 1 187 | -38,72 | 9,97 | 4,71 | ||||
| costs in work in progress (distribution costs) | -12,50 | 0,12 | 0,08 | ||||||
| finished products and goods for resale | 8 432 | 7 368 | -1 064 | -12,62 | 43,40 | 29,22 | |||
| goods shipped | – | – | – | – | – | – | |||
| Future expenses | +53 | +110,42 | 0,25 | 0,40 | |||||
| Continuation of Table 2.3 | |||||||||
| Value added tax on purchased assets | 2 167 | 1 807 | -16,61 | 11,15 | 7,17 | ||||
| Accounts receivable for which payments are expected more than 12 months after the reporting date | – | – | – | – | – | – | |||
| Accounts receivable for which payments are expected within 12 months after the reporting date | 5 699 | 11 255 | +5 556 | +97,49 | 29,33 | 44,64 | |||
| Short-term financial investments | 1 099 | 3 353 | +2 254 | +205,10 | 5,66 | 13,30 | |||
| Cash | +83 | +345,83 | 0,12 | 0,42 | |||||
| Other current assets | – | +14 | – | – | 0,06 | ||||
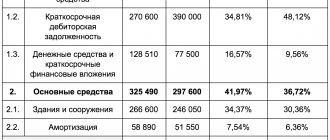
Analytical tables 2.1 – 2.3 reflect information on the basis of which the property position of the joint-stock company can be assessed. Analysis of the data from these tables shows that during the reporting period, the property of the enterprise as a whole increased significantly - by 27.44%, i.e. by 6,047 thousand rubles. This increase is due to an increase in the value of both current assets and non-current assets (by 29.76% and 10.11%, respectively). In monetary terms, the increase amounts to 5,783 thousand rubles. and 264 thousand rubles. respectively. But in the structure of the enterprise’s property, current and non-current assets have different shares: the share of current assets (88.15% at the beginning of the reporting year and 89.76% at the end of the reporting year) significantly exceeds the share of non-current assets (11.85% - at the beginning of the reporting year and 10.24% at the end of the reporting year). At the same time, the share in the reporting period remained at a relatively unchanged level.
The increase in non-current assets in the reporting year was due to a significant increase in construction in progress by 101.10% and fixed assets by 3.17%. At the same time, the share of fixed assets in the overall structure of non-current assets of the enterprise decreased at the end of the reporting year (92.91% at the beginning of the year and 87.06% at the end of the year), and the share of construction in progress increased (7.09% at the beginning year and 12.94% at the end of the year). An increase in unfinished construction indicates an increase in the potential capabilities of the enterprise, since in subsequent reporting periods this will lead to an increase in fixed assets, and therefore to an increase in depreciation charges.
Current (current) assets increased due to an increase in cash (by 345.83%). These are positive changes for the company. However, during the reporting period there was a decrease in inventories (by 16.89%).
An increase in accounts receivable, payments for which are expected within 12 months after the reporting date, by 97.49% for the reporting year is not a positive factor in strengthening the financial condition of the enterprise in question. However, increased cash flow may partially offset this.
- Assessment of the capital structure invested in property
Creating and increasing the property of an enterprise is possible at the expense of own and borrowed funds (capital). Changes in capital are reflected in the liability side of the balance sheet (sections III – V).
Let us analyze the size and structure of sources of own and borrowed funds invested in property using the data in Table 2.4 as an example.
Table 2.4
In order to analyze the current state of the company, you will need to derive an analytical balance sheet. Using the data contained in it (current and non-current assets, profit, costs, etc.), you can determine the main factors that hinder the achievement of a high level of profitability or, on the contrary, increase it.
The most important tool of financial analysis is considered to be profitability ratios. This is completely justified. Comparing profits with advance costs/investments allows us to give a fairly accurate assessment of the solvency, and therefore the investment attractiveness of the enterprise.
Return on assets/ROA (mobile and immobilized assets) is the first thing professionals pay attention to. Their ratio demonstrates the extent to which the invested funds pay off, that is, how much profit each monetary unit spent brings.
An analysis of business performance should answer questions regarding: the current financial condition and its dynamics, market stability, creditworthiness, total value of property, solvency, amount of funds (own and borrowed).
Only an integrated approach will provide an understanding of reality and development prospects.
The principle of equal balance
The basic principle of drawing up a balance sheet is that the total value of assets is always equal to the total indicators of liabilities in the report. Of course, arithmetic differences are allowed in exceptional cases. But all identified discrepancies must be justified economically.
The equality of assets and liabilities of the balance sheet is due to the fact that all entries in accounting are reflected using the double entry method. The essence of this method is that when reflecting any fact of economic activity on the balance sheet accounts of an enterprise, an entry is formed in the debit of one account and at the same time in the credit of the corresponding account, but in the same amount.
The principle of double entry expresses the pattern that when one side of the balance sheet, asset or liability, changes, a similar movement must be reflected on the other side. If the amount of an asset increases in an institution, then at the same time the indicator of liabilities or capital - the sources through which property assets were acquired - must increase. Or a decrease in other types of assets is reflected.
For example, an increase in the value of fixed assets. If the company has paid for the cost of the property, then as the indicators of non-current assets increase, the indicator of current assets (cash) decreases. It turns out: the non-current asset increased and at the same time the current asset decreased. For example, a company purchased and paid for materials. In this case, the dynamics of the indicators is reflected within one section of the balance sheet “Current assets”. The value of inventory increases, but the amount of cash decreases.
If a company has received fixed assets (equipment, machinery), but has not yet paid for them, then accounts payable are formed in the company’s accounting. The value of a non-current asset increases, and the amount of debt obligations on the balance sheet also increases. Short-term or long-term - depending on the period of settlements.
If current assets exceed non-current assets - what does this mean?
The proportion determined from the ratio of current assets to non-current assets characterizes the level of financial stability of enterprises. Business entities in which non-current assets have an advantage are more capital-intensive; the ratio of such enterprises is less than 1.
If the indicator exceeds 1, this indicates that the company has a predominance of current assets. This advantage indicates good financial stability of the business entity, since current assets are more liquid and therefore are able to bring in money in a short time. This coefficient is typical for material-intensive industries and commercial enterprises. If the indicator is equal to 1, this indicates the comparability of the use of both types of assets.
Analysis and timely comparison of the dynamics of the ratio will help the business entity regulate the predominance of a particular asset, as well as take measures in the event of an unfavorable decline in the level of each asset.
Current and non-current assets take part in the calculation of many financial and economic indicators, reflect the liquidity of certain assets, the financial stability of an economic entity, which allows you to track the level of financial condition of the enterprise as a whole.
Classification of non-current assets
In order to manage assets and extract maximum profit from their use, organizations classify assets according to a number of criteria. Based on the nature of servicing the company’s activities, the following types of VA are distinguished:
- operating or production – directly used for the manufacture of products
- investment – aimed at investing in the development of subsidiaries or creating new sources of income
- non-production – social and domestic facilities
Non-current assets - fixed assets
Non-current assets are the fundamental basis of an organization's production process. The final financial result of the organization depends on how they are formed at the initial stage of creating a company, how they are managed in the future, how their structure changes, and how effectively they are used in the business process.
An increase in non-current assets indicates the acquisition of fixed assets (equipment, buildings, structures) and intangible assets, investments in the construction of new fixed assets or long-term financial investments. A decrease in non-current assets indicates the sale of fixed assets (other non-current assets), the accrual of depreciation (that is, physical wear and tear of production facilities) or the write-off of fixed assets due to their liquidation (the write-off of other non-current assets).
Non-current assets require long-term investments. The need for non-current assets is covered mainly by the organization's own capital and sometimes by borrowed funds. The more non-current assets an organization has, the more financial resources are required to maintain them and, therefore, the greater the share of equity capital should be in the sources of financing the company’s activities.
Formula for calculating the liquidity ratio of current assets
To calculate the rate of asset turnover and quickly track the solvency of the company, financiers calculate the current liquidity ratio of the company. This indicator shows whether the company can pay off current obligations at the expense of OA. Accordingly, the higher it is, the better for the company. Formula for calculation:
Ktl = OA/Co,
Where:
Ktl - current liquidity ratio,
OA - current assets,
Co - short-term liabilities.
Important! Hint from ConsultantPlus The source of information for financial analysis is the balance sheet... Possible type of formula (balance sheet line): Ktl = (line 1200 - line 1230 - line 1220) / (line 1510 + line 1520 - line 1550 ). Read more about liquidity analysis in K+. Trial access is free.
Find out which balance sheet lines to use to calculate the ratio in the publication “Current liquidity ratio (balance sheet formula).”
Analysis of non-current assets
VA are the production basis of the enterprise, so it is important to analyze changes in their structure over time. Three types of VA analysis can be distinguished:
structures
speakers
coefficients
Data from the financial statements of the enterprise are used for analysis.
Structure of non-current assets
The VA structure shows which type of asset has a greater share in the enterprise. When conducting this type of research, it is necessary to take into account the specifics of the company’s activities. For example, for a manufacturing enterprise, fixed assets should have a greater share, while for a company in the financial sector - investments and other long-term investments.
The structure of non-current assets is presented in the table.
What can be classified as low-liquid current assets?
Liquidity is an indicator of the speed at which an asset is converted into money. A very important aspect in making a company profit is the competent management and control of OA. To carry out the control functions of the company and determine risks, it is necessary to develop a gradation that will allow determining the possible liquidity of the asset in the event of a crisis situation. In the economic literature, a variant of risk gradation by degree has been proposed.
| Risk level | Type of asset | Liquidity |
| Minimum | Cash, short-term financial investments | High |
| Small | Inventory and finished products (subject to quick implementation) | High |
| Average | Unfinished production | Average |
| High | Unused goods, overdue accounts receivable, high volumes of work in progress | Low |
Low-liquid assets are considered to be those assets whose conversion into money takes more than a year. For example, a receivable with an expected return period of more than 12 months or goods stored in warehouses. That is, all OA that are considered high risk are considered the least liquid.
For details, see the material “Which current assets are the least liquid?”
Accounting for non-current assets
For accounting purposes, VA is reflected separately for each position. Property is taken onto the balance sheet at its original cost, which includes:
- price of the object
- transportation costs
- costs of bringing the facility to working condition
Before accepting these assets for accounting, all costs for their acquisition are formed on the account “investments in non-current assets”, after which the costs are summed up and the initial cost of the object is obtained. This cost is reflected in accounting.
For example, a company bought a lathe for 39,000 rubles. Delivery and installation costs amounted to 11,000. A machine with an initial cost of 50,000 (39,000 + 11,000) will be taken into account.
The reporting reflects the residual value of the VA. That is, depreciation is subtracted from the original total cost, which in turn is included in the cost of manufactured products.
Each enterprise is required to conduct an inventory of property, work in progress and inventory annually. This norm is contained in Order of the Ministry of Finance No. 34n dated July 29, 1998.