At the end of the first half of the year, any enterprise needs to evaluate the results of its activities, because half of the reporting period is already behind us and there is enough data for calculations and analysis. At this stage, the company has the opportunity to adjust plans for the future.
The main source of information for analyzing activities for the first half of the year is financial statements (as well as for the year).
Normative base
Features of the preparation and submission of financial statements to the tax authorities are provided for:
- Tax Code of the Russian Federation (hereinafter referred to as the Tax Code of the Russian Federation);
- Federal Law dated December 6, 2011 No. 402-FZ “On Accounting” (as amended on May 23, 2016);
- Accounting Regulations “Accounting Reports of an Organization” (hereinafter referred to as PBU 4/99), approved by Order of the Ministry of Finance of Russia dated July 6, 1999 No. 43n (as amended on November 8, 2010);
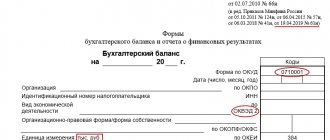
- Order of the Ministry of Finance of Russia dated July 2, 2010 No. 66n “On the forms of financial statements of organizations” (as amended on April 6, 2015).
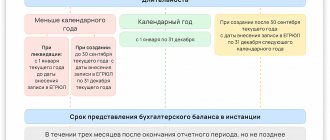
Accounting statements prepared for the month and quarter on an accrual basis from the beginning of the reporting year are called interim. Enterprises are required to form it no later than 30 days after the end of the reporting period.
Since only annual financial statements need to be submitted to the tax office (Article 23 of the Tax Code of the Russian Federation), interim reporting, as a rule, is necessary to analyze activities for the first half of the year, as well as for presentation to shareholders and founders, investors, members of the board of directors or a credit institution.
A distinctive feature of interim reporting from annual reporting is its composition - it includes only a balance sheet and a statement of financial results. This set of documents and information in them is sufficient to conduct a correct analysis of the enterprise’s activities for six months.
We recommend
There are no unified forms of interim reporting, therefore organizations have the right to develop their own reporting forms subject to the requirements of PBU 4/99. We recommend that in the case of independent development of interim reporting forms, we take annual reporting forms as a basis - forms according to OKUD 0710001 (balance sheet) and OKUD 0710002 (financial performance report), and in the accounting policy - approve the interim reporting forms, indicate the reporting period, the composition of the statements and etc.
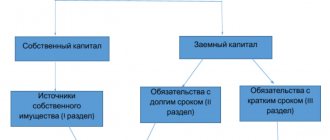
So, based on the interim reporting data of the enterprise for the first half of the year, it is possible to assess the efficiency of capital allocation, the structure of borrowed and equity funds, and the financial performance of business activities. We will do:
- horizontal and vertical analysis of interim financial statements;
- analysis and assessment of the liquidity and solvency of the enterprise;
- analysis and assessment of the financial stability of the enterprise;
- analysis and assessment of enterprise profitability indicators;
- adjustment of financial plans.
Formation of indicators for analyzing the organization’s balance sheet
The balance sheet is the main reporting document of any organization.
The composition of its indicators may vary from company to company, but the analysis is based on general principles and methods. ATTENTION! From 2022, financial statements will be submitted exclusively in electronic form. Paper forms will no longer be accepted. Read more about changes to the rules for presenting financial statements here. We also remind you that in 2022 the reporting forms have been updated.
Analysis of the balance sheet is of practical importance if it is based on reliable information. To avoid its distortions (accidental or intentional), the enterprise must have an internal control system (Article 19 of the Law “On Accounting” dated December 6, 2011 No. 402-FZ). And to externally confirm the reliability of the balance sheet, an audit is used (clause 3 of the Law “On Auditing” dated December 30, 2008 No. 307-FZ). In some cases this is mandatory (Article 5 of Law No. 307-FZ). The list of companies subject to mandatory reporting audit can be found on the website of the Russian Ministry of Finance.
All mandatory accounting reports must meet the requirements for them: comparability, consistency, etc.
Look at a sample balance sheet prepared by ConsultantPlus experts. Get trial access to the system and proceed to the material. It's free.
For more information about what requirements the balance sheet must meet, see the material “What requirements must accounting records satisfy? ”
Let's consider the main stages of the analysis of the balance sheet.
Advantages
The main advantage of vertical analysis is that it can identify major or abrupt changes in a firm's financial statements. Rapid growth or decline of individual financial reporting indicators will be easily visible over time.
This technique also allows you to get an idea of the various strategies that the company implements. For example, one company may sacrifice profitability in pursuit of increasing its market share. This will generally result in increased sales revenue, but will have a negative impact on gross, operating and net income. However, such a company will demonstrate higher growth rates.
- ← DuPont model
- Horizontal analysis of financial statements →
Analysis of the balance sheet using an example: preliminary stage
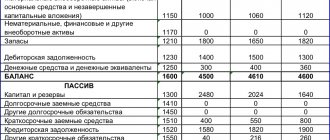
Let's consider an example of analyzing the balance sheet of an enterprise. The balance sheet of Sekunda LLC as of December 31, 2020 is as follows:
| Indicator name | Code | As of 12/31/2020 | As of 12/31/2019 | As of 12/31/2018 |
| ASSETS | ||||
| Fixed assets | 1150 | 320 | 250 | 200 |
| Reserves | 1210 | 205 | 160 | 115 |
| Accounts receivable | 1230 | 170 | 190 | 160 |
| Financial investments (excluding cash equivalents) | 1240 | 50 | 50 | — |
| Cash and cash equivalents | 1250 | 120 | 210 | 25 |
| BALANCE | 1600 | 865 | 860 | 500 |
| PASSIVE | ||||
| Authorized capital | 1310 | 10 | 10 | 10 |
| retained earnings | 1370 | 385 | 210 | 85 |
| Accounts payable | 1520 | 470 | 640 | 405 |
| BALANCE | 1700 | 865 | 860 | 500 |
The first reading of this report can be called introductory: the balance sheet figures assess the general structure of property and liabilities, the availability of raised funds, etc.
In this case, we are dealing with a developing company: an annual increase in the balance sheet currency, the appearance of financial investments in the asset structure, an increase in the cost of fixed assets (which may indicate the company’s intentions to invest in the development of its production potential), a steady decrease in debts - and all this without attracting long-term borrowed funds.
Preliminary conclusions have been made and we can proceed to a more detailed analysis. To do this, we will conduct a horizontal and vertical analysis of the balance sheet.
Understanding the results of the horizontal analysis performed
The interpretation of the results depends on the phenomenon being studied. For example, a decrease in the value of fixed assets may be evidence of a decrease in the production potential of the enterprise, i.e. is a negative phenomenon. At the same time, the reduction in unfinished construction projects indicates that the enterprise has introduced new fixed assets into its activities, i.e. is a positive thing. An increase in the amount of equity capital leads to an improvement in financial stability indicators.
Horizontal analysis of the balance sheet
Using horizontal analysis, we compare the balance sheet indicators by reporting dates (to simplify the example, we use data at the beginning and end of the reporting period):
| Balance sheet item | As of 12/31/2020 | As of 12/31/2019 | Deviation (+/–) | |
| sum | % | |||
| Property dynamics | ||||
| Including: non-current (OS) | 320 | 250 | +70 | +28,00 |
| negotiable | 545 | 610 | –65 | –10,65 |
| Reserves | 205 | 160 | +45 | +28,13 |
| Accounts receivable | 170 | 190 | -20 | –10,53 |
| Financial investments (excluding cash equivalents) | 50 | 50 | – | – |
| Cash and cash equivalents | 120 | 210 | -90 | –42,86 |
| Capital dynamics | ||||
| Including: equity | 395 | 220 | +175 | +79,55 |
| Authorized capital | 10 | 10 | – | – |
| retained earnings | 385 | 210 | +175 | 83,33 |
| borrowed capital | 470 | 640 | –170 | –26,56 |
| Sources of funds in calculations (accounts payable) | 470 | 640 | –170 | –26,56 |
A horizontal analysis of the balance sheet showed the following: during the reporting period, non-current assets increased by 28%, which may indicate the expansion of activities and growth of the company’s economic potential. At the same time, working capital decreased (by 10.65%) - mainly due to a decrease in cash balances (by 42.86%). There was an increase in working capital in inventories by 28.13%, which indicates a decrease in liquidity and may affect the solvency of the company. The presence of short-term financial investments in the current assets indicates a desire to invest funds in order to obtain additional profit. The growth of the balance sheet currency must also be compared with the rate of inflation and revenue growth.
If you have access to ConsultantPlus, find out how to assess the solvency of a counterparty based on the balance sheet. If you don't have access, get a free trial of online legal access.
Methodology
Carrying out horizontal analysis involves comparing indicators both in absolute and relative terms.
Formula
At the first stage of the analysis, absolute deviations of financial reporting items relative to the base period are calculated.
This allows you to identify items for which deviations were the largest in monetary terms.
At the second stage, relative changes in the analyzed indicators compared to the base period are calculated.
In this case, the magnitude of absolute deviations is normalized relative to the value in the base period. This is convenient when comparing several companies of different sizes and scales of activity.
For example, if revenue in the current period amounted to CU 11,980 thousand, and its value in the base period was CU 10,530 thousand, then the absolute deviation of this indicator will be CU 1,450 thousand, and the relative 13.8%.
The reliability of the results of horizontal analysis increases as the number of accounting periods analyzed increases. Typically, the accounting period is a year or a quarter, less often monthly reporting data.
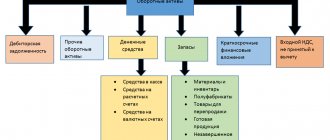
Determination of the structure of articles (vertical analysis) and the share of indicators
Using this type of balance sheet analysis, we examine the structure of indicators over time:
| Balance sheet item | As of 12/31/2020 | As of 12/31/2019 | Shifts in structure, % | ||
| sum | % to total | sum | % to total | ||
| Property structure | |||||
| Including: non-current assets (OC) | 320 | 36,99 | 250 | 29,07 | +7,92 |
| current assets | 545 | 63,01 | 610 | 70,93 | –7,92 |
| Reserves | 205 | 37,61 | 160 | 26,23 | +11,38 |
| Accounts receivable | 170 | 31,20 | 190 | 31,15 | +0,05 |
| Financial investments (excluding cash equivalents) | 50 | 9,17 | 50 | 9,17 | – |
| Cash and cash equivalents | 120 | 22,02 | 210 | 34,43 | -12,41 |
| Capital structure | |||||
| Including: equity | 395 | 45,66 | 220 | 25,58 | +2,02 |
| borrowed capital | 470 | 54,36 | 640 | 74,42 | – |
A vertical analysis of the balance sheet showed that during the reporting period there were no significant changes in the overall structure of property and capital.
The growth of non-current assets amounted to 7.92%. In the structure of current assets, small structural changes are observed in the lines “Cash and cash equivalents” (12.41%) and inventories (11.38%). An increase in working capital in inventories reduces their turnover, which may negatively affect current liquidity. The share of equity in the balance sheet currency amounted to 45.66% at the end of the period, mainly due to the share of retained earnings in equity (97.47%). There are no uncovered losses on the balance sheet.
The company does without long-term loans and borrowings, that is, the volume and structure of equity capital allows it to organize the production process and develop without external borrowings.
Vertical balance sheet analysis (structural). Examples with conclusions
Basic information about vertical analysis of accounting data can be seen in the list below:
- Structural analysis is to demonstrate the structure of the final accounting information. reporting in the form of relative indicators expressed as percentages. As a result of the study, the expert receives the values of all balance sheet items as a percentage of its total.
- The advantage of vertical analysis over horizontal analysis is that in absolute terms it is difficult to see whether positive or negative dynamics are observed in the company’s work. Relative values, on the contrary, make it easy to assess whether financial indicators have deviated for the worse or for the better, and to what extent. The obtained output data in relative values will not allow for incorrect comparisons due to the influence of various external factors, such as the inflationary process.
- This method of analysis differs from horizontal analysis in that vertical analysis is focused on a selected moment and provides an assessment of the company’s position on the day the report is issued. The method is used when necessary:
- see how certain accounting items have changed in comparison with previous periods. balance;
- compare the capital structures of several companies or enterprises in different fields of activity;
- find out the composition of external and working capital;
- find out whether the size of the company's borrowed capital has decreased or increased;
- check how the structure of liabilities and assets has changed.
The essence of using structural balance sheet analysis is as follows:
- The total amount of revenue when analyzing the company's financial performance statement (form No. 2) is taken equal to 100%. If the balance sheet is examined, the total amount of assets is taken as 100%. Vertical analysis is also suitable for studying the statement of cash flows (form No. 4) and changes in capital (form No. 3).
- All balance sheet items are individually calculated as a percentage of 100% (i.e., the total amount of assets or revenue). To implement this, the analyst must select the period (year) of activity of the analyzed company, and then divide each individual balance sheet line by the accounting currency. balance, and then multiply the result by one hundred percent (since the value must be relative, in %).
Let's return to point 2 of the algorithm, which was given above the table. Let's find out how the values in the table were obtained using the example of current assets:
- For January 1, 2015:
- For January 1, 2016:
- Increase in assets in 2016 compared to last year:
Now that we understand how the data in the table was calculated, let's analyze it and draw conclusions:
- The amount of long-term debt of the analyzed company decreased slightly.
- The amount of equity (shareholder) capital is 50% of the total liabilities (this indicates that the company is characterized by an average level of stability).
- Short-term debt makes up a third of the balance sheet and remains virtually unchanged.
- The number of OS objects is reduced because some of them are going out of circulation.
- 63% of assets account for working capital, and the increase in their share was a consequence of the growth of accounts receivable (the company's management should think about the reasons for its growth).
Let's try to conduct a vertical analysis of data for 2 years of operation of the enterprise in absolute and relative values:
In general, the interpretation of a set of balance sheet output data is carried out by professional financial analysts and auditors, since it is necessary to be able to see the big picture and draw conclusions based on comprehensive research. What can be said unambiguously to a non-specialist, looking at the table we received, is that:
- the analyzed company has no changes in its own funds in the form of authorized capital, but the amount of available equity capital has increased by 8% due to the presence of retained earnings;
- the company has attracted a fairly large amount of borrowed funds, liabilities include >60% of accounts payable, but the positive side is a decrease in the level of loans in dynamics;
- the enterprise is solvent and quite stable financially, since there is a decent level of cash (48.22%);
- the company does not competently select counterparties for cooperation; most likely, the current partners are insolvent, because there is a high level of accounts receivable;
- the data from the table indicates that the level of accounts receivable and inventory of the company is high, and therefore there are fewer non-current assets than current assets (the bad thing is that there may be extra costs for storing inventory (logistics), but the good thing is that managers care about investing funds into uninterrupted production).
Analyzing the Balance Sheet Using Financial Ratios
By calculating special coefficients, further analysis of the balance sheet is carried out:
Solvency analysis
| Coefficient | Calculation | Recommended Range | |
| Formula | Sum | ||
| Financial dependency ratio. Read more about the coefficient in the article “Financial dependence coefficient (balance sheet formula)” | Balance sheet currency / equity | 865 / 395 = 2,2 | ≤2,0 |
| Financial independence ratio. Read more about the coefficient in the article “Financial independence coefficient (formula)” | Own capital / balance sheet currency | 395 / 865 = 0,46 | ≥0,5 |
| Total Solvency Ratio | Balance sheet currency / borrowed capital | 865 / 470 = 1,84 | ≥1,0 |
| Debt ratio | Debt capital/equity | 470 / 395 = 1,19 | ≤1,0 |
Liquidity analysis
| Coefficient | Calculation | Recommended Range | |
| Formula | Sum | ||
| Instant liquidity ratio | (DS and DE)*/ KO*** | 120 / 470 = 0,26 | >0,8 |
| Absolute liquidity ratio | (DS and DE + KFV**) / KO | (120+50) / 470 = 0,36 | >0,2 |
| Quick ratio | (DS and DE + KFV + DZ) / KO | (120 + 50 + 170) / 470 = 0,72 | ≥1,0 |
| Average liquidity ratio | (DS and DE + KFV + DZ + Reserves) / KO | (120 + 50 + 170 + 205) / 470 = 1,16 | >2,0 |
| Intermediate liquidity ratio | (DS and DE + KFV + DZ + Inventories + VAT) / KO | (120 + 50 + 170 + 205) / 470 = 1,16 | ≥1,0 |
| Current ratio | Current assets / KO | 545 / 470 = 1,16 | 1,5–2,0 |
* (DS and DE) - cash and cash equivalents.
** KFV - short-term financial. attachments.
*** KO - short-term liabilities.
For more information about liquidity ratios, read the article “Calculation of the liquidity ratio (balance sheet formula)” .
An analysis of the balance sheet using financial ratios showed that solvency indicators are close to the recommended ones. However, the instant, quick and current liquidity ratios show the insufficiency of working capital to repay short-term liabilities at the reporting date.
In addition, it is necessary to calculate financial stability coefficients (autonomy, agility, etc.).
Our articles will help you do this:
- “What does the autonomy coefficient show - the balance formula?”;
- “Agility coefficient (balance sheet formula)” and other materials in the “Analysis of Economic Activity (ABA)” .
Analysis of the obtained values
The balance displays the balance status and meets a number of requirements:
- The balance sheet currency at the end of the period under review increases relative to the beginning of the period.
- The rate of currency growth exceeds the rate of inflation, but is less than the rate of revenue growth.
- The rate of increase in current assets is higher than the rate of growth of non-current values and short-term debts.
- The volume of long-term borrowed funds is greater than the values for non-current assets.
- The amount of equity capital is at least 50%.
- All parameters (rate, volume) of receivables and payables are approximately the same.
- There are no uncovered losses or they are extremely small.
IMPORTANT! When analyzing, you need to pay attention to new trends in accounting methods and changes in accounting policies.
Trend, factor and comparative analysis
In addition to the above stages of balance sheet analysis, trend, factor and comparative types of analysis can be carried out. They will complement and expand the volume of analytical data for making the necessary economic decisions.
Thanks to trend analysis, you can form an opinion about the main trend of changes in certain indicators (predictive analysis).
For example, a joint study of the dynamics of short-term debt and cash:
| Balance indicator | As of 12/31/2018 | As of 12/31/2019 | As of 12/31/2020 |
| Accounts payable | 405 | 640 | 470 |
| Cash and cash equivalents | 25 | 210 | 120 |
From the above figures it follows that, as of reporting dates, the nature of changes in the amount of short-term debts corresponds to changes in the volume of cash, but the company’s free cash is not enough to repay these debts.
Using factor analysis, the nature of the influence of the main factors on the change in the value of the indicator under study is determined. It is carried out according to a certain method of analyzing the balance sheet.
To carry out a comparative analysis, additional information is needed - the balance sheet data of one company is not enough. This is due to the fact that when carrying out this type of analysis, the balance sheet indicators of different companies are compared in order to determine their rating.
Directions for using horizontal enterprise analysis
conclusions
Liquidity analysis
The main function of horizontal analysis is to compare parameters for the current period, as well as the previous period. As a result, it is possible to determine the dynamics, based on which conclusions can be drawn.
Horizontal analysis is a comparative analysis of financial indicators for periods of interest. When calculating, you need to take the values by line, and also track its changes over several periods.
These periods can be completely different intervals. However, typically the analysis is carried out by quarter or year. The number of periods that are analyzed may vary. It all depends on the tasks assigned. If a qualitative analysis is carried out, 3 periods are taken into account when calculating. As a rule, this technique is carried out to analyze the balance sheet, profit and loss statement, and changes in capital. Horizontal analysis can be carried out according to two approaches:
- Change in absolute values (for example, in rubles).
- Change in relative values (for example, percentage).
The approaches complement each other. The most understandable example of horizontal analysis is determining changes in values relative to the previous period. For example, the company’s revenue for the quarter increased by 25%.
ATTENTION! Horizontal and vertical analyzes are essentially opposite. The horizontal method allows you to trace changes over different periods. The vertical method involves tracking changes within the boundaries of one period.
Features of the analysis
When performing horizontal cash analysis, you need to follow a number of rules:
- The main parameters that you should pay attention to are cash deposits, cash, and receivables. These options display available available funds.
- If you want to form a complete picture of changes, you need to analyze the balance sheet of the last 2-3 years.
The work is carried out on the basis of company documentation.
Structure
If required, you can use additional parameters.
The employee needs to determine ways to form the company’s own funds. To do this, you need to analyze the liabilities of the balance sheet. When analyzing the flow of funds, you need to focus on a number of items, such as:
- Debts to creditors.
- Borrowed funds.
- Amount of authorized capital.
- Income that will be received in the following periods.
- Retained earnings.
As a rule, available funds are generated from proceeds from the company's clients. A decrease in value indicates either a decrease in advances or a decrease in demand.
ATTENTION! Horizontal analysis provides only approximate indicators. If alarming values are detected as a result, various coefficients will need to be additionally calculated.
READ MORE: Repair costs for own fixed assets are reflected in accounting with the following entries
Example
| Name | Value at the beginning of the year (%) | End of year value (%) |
| Fixed assets | 56 | 66 |
| Accounts receivable | 6 | 3 |
| Authorized capital | 10 | 8 |
A full analysis uses a much larger list of parameters. Comparing the data of two columns allows you to track the changes. Based on them, a conclusion is drawn about the financial condition of the company. To get a complete picture, you need to study all the indicators, as well as determine the reasons for the changes.
Conducting horizontal analysis for the balance sheet pursues the following goals and objectives:
- Assessing the dynamics of changes in the organization's assets and liabilities.
- Determination of the share of sources of financing of the company's capital.
- Diagnostics of changes in capital structure: shares of equity and borrowed funds, receivables and payables.
- Assessment of the operating efficiency of an enterprise expressed in the dynamics of net profit.
- Identify negative trends in the growth of balance sheet items that increase the degree of maneuverability of the company and its financial stability.
The resulting assessment is used in diagnosing the financial condition of the enterprise and allows us to identify problem areas. Managing and tracking critical changes in balance sheet indicators allows you to make timely management decisions. Horizontal analysis is also used to analyze the indicators of the income statement and cash flow statement.
After conducting a comprehensive financial analysis of the state of the enterprise, they additionally use ratio and model analysis (models of solvency and bankruptcy assessment). For more information on the key ratios of financial analysis, read the article: → Top 12 main ratios for the financial analysis of an enterprise from Vasily Zhdanov.
| ★ Horizontal and vertical balance sheet analysis in Excel in 5 minutes (conducting horizontal and vertical balance sheet analysis) purchased by {amp}gt; 200 excel tables with formulas, calculations and graphs |
Let's consider the main methods (approaches) of horizontal analysis of reporting and directions for their practical application ⇓.
| Horizontal analysis methods | Application areas |
| Comparison of financial values of the reporting period with indicators of the previous period | Used to assess short-term trends and express comparisons between the current and previous periods |
| Comparison of indicators for the reporting period with indicators for the same period last year | Used by organizations with seasonality in production and sales of products, which is also reflected in financial statements |
| Comparison of a number of financial indicators for previous periods | Used by companies to assess the long-term trend and growth/decline rate of key financial indicators |
| Comparative analysis of company indicators with industry indicators | Assessing the company’s position in the industry and the degree of its operating efficiency and competitiveness |
Specifics of analyzing the balance sheet of individual companies using the example of a bank balance sheet (Form 1)
Banks, although they are commercial companies and are created to make a profit, have specific features. They are subject to special legislation, maintain a special chart of accounts and build a different methodology for accounting processes.
At the same time, the main approaches to analyzing a bank’s balance sheet are in many ways similar to analyzing the balance sheet of an ordinary commercial company. For the bank balance sheet, the main stages of analysis also remain relevant:
- preliminary (reading the balance sheet, structuring its items, etc.),
- analytical (description of calculated indicators of structure, dynamics, relationship between balance sheet indicators);
- final (evaluation of analysis results).
In the process of analyzing the bank’s balance sheet, special coefficients are also calculated, but their types differ from those discussed earlier:
- bank reliability coefficient (capital adequacy ratio),
- return on assets ratio (shows the efficiency of using assets and quality based on their profitability),
- leverage ratio (interbank loans), etc.
To learn how banks analyze the creditworthiness of their clients, read the material “Methods for assessing the creditworthiness of commercial bank clients.”
Analysis and assessment of financial stability
Financial stability is affected by the share of borrowed funds. It is not a very good indicator if borrowed funds account for more than half of the company's funds.
Financial stability can be analyzed both in the long and short term based on absolute and relative indicators (Table 3).
Table 3. Key indicators of financial stability.
| Index | Description and meaning |
| Autonomy coefficient | The ratio of equity to total equity. Generally accepted normal value: 0.5 or more (optimal 0.6-0.7); however, in practice it varies greatly by industry. |
| Financial leverage ratio | The ratio of debt to equity capital. |
| Provision ratio of own working capital | The ratio of equity capital to current assets. Normal value: 0.1 or more. |
| Investment coverage ratio | The ratio of equity and long-term liabilities to total equity. Normal value for this industry: 0.7 or more. |
| Inventory coverage ratio | The ratio of own working capital to the amount of inventories. Normal value: 0.5 or more. |
| Short-term debt ratio | The ratio of short-term debt to total debt. |
| Equity agility ratio | The ratio of own working capital to sources of own funds. |
| Property mobility coefficient | The ratio of current assets to the value of total property. Characterizes the industry specifics of the organization. |
| Working capital mobility coefficient | The ratio of the most mobile part of working capital (cash and financial investments) to the total value of current assets. |
Also, the financial stability of an organization reflects the liquidity of assets in comparison with the current and quick liquidity ratios.
Online program to facilitate the analysis process
Modern information processing tools can significantly simplify the process of comprehensive analysis of the balance sheet. Calculations are carried out both using standard computer programs (for example, using Excel, where you can carry out calculations, create tables and charts), and using specialized programs that allow you to conduct financial analysis online - via the Internet.
The use of specialized software not only saves time, but also significantly expands the types of analysis. They allow you to analyze market stability, business activity, score assessment of financial stability, etc. In addition, developers of specialized programs provide the possibility of adapting and changing the program depending on the goals and objectives of the analysis, taking into account the specifics of a particular enterprise.
conclusions
The balance sheet reflects the company's assets and the sources of its formation.
As a result of the analysis of the balance sheet, the dynamics of assets and liabilities are revealed and its causes are established. In this case, the balance sheet total for the year may increase or decrease.
Submit accounting and any other reports in the Astral Report 5.0 service. Our users always have access to the latest versions of all types of reports and declarations. And the list of to-dos on the main page will remind you of the deadlines for submitting reports and show an unanswered request from the Federal Tax Service.
Results
Analysis of balance sheet indicators is a voluminous and multi-stage process. Its results make it possible to identify potential risks, develop the financial policy of the enterprise and contribute to effective management decisions. The analysis process can be facilitated by using specialized programs.
Sources:
- Federal Law of December 6, 2011 No. 402-FZ
- Federal Law of December 30, 2008 No. 307-FZ
You can find more complete information on the topic in ConsultantPlus. Free trial access to the system for 2 days.
Characteristics of the method
Vertical analysis means expressing financial data in relation to a specific element of the financial statements. This means that all elements of the reporting form for a certain period are divided into this element.
A simpler definition: it is dividing all the numbers in a column by one of those numbers.
The elements that are most often used as the base value by which other elements are divided are assets and revenue. Essentially, vertical analysis creates a ratio between each financial statement item and the underlying element.
Vertical analysis allows you to determine the structure of the main elements of the organization's assets and liabilities , the influence of individual factors on the financial result, and liquidity indicators.
Explanation of the results of vertical reporting analysis
When substantiating conclusions on the identified structure of assets and liabilities, it is necessary to pay attention to the scope of activity of the enterprise, the history of its functioning, the state of the market and the influence of its participants, and the capital structure. In industrial enterprises, the majority of assets under normal conditions are non-current assets, while in a trading enterprise they are inventories of goods.
Related materials
- Capital structure according to various characteristics
- Horizontal analysis
- Comparison method
The same applies to the sources of financing of the enterprise - a high share of equity capital indicates low financial risks, but also the incomplete use of its potential by the enterprise. In conditions of stable market functioning, such a capital structure may be optimal, but if there is an opportunity to increase presence on it, it is important to attract additional borrowed funds to intensify its activities.