Balance sheet analysis can be carried out directly from the balance sheet or from an aggregated analytical balance sheet. Let's consider six stages of balance sheet analysis: analysis of the dynamics and structure of the balance sheet, analysis of the financial stability of the organization, analysis of the liquidity of the balance sheet and solvency of the enterprise, analysis of the state of assets, analysis of business activity and diagnostics of the financial condition of the enterprise.
Analysis of financial statements includes analysis of all its forms, including explanatory notes and the final part of the auditor's report.
During the preliminary analysis of financial statements, the dynamics of “sick” reporting items of two types are identified and assessed:
- indicating the extremely unsatisfactory performance of a commercial organization in the reporting period and the resulting poor financial position (uncovered losses, overdue loans and accounts payable, etc.);
- indicating certain shortcomings in the organization's work, which, if they are regularly repeated in the reporting of several adjacent periods, can significantly affect the financial position of the organization (overdue accounts receivable, debt written off to financial results, fines, penalties, penalties collected from the organization, negative net cash flow, etc.)
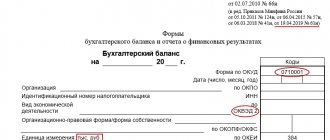
Balance sheet analysis can be carried out directly from the balance sheet or from the aggregated analytical balance sheet presented below.
The items (lines) of the balance sheet that are recommended to be included in the selected groups of the analytical balance sheet are indicated in brackets. Table 1. Aggregated analytical balance
| Symbol | For the beginning of the year | At the end of the year |
| Assets | ||
| 1. Cash and short-term financial investments (page 250 + page 260) | DS | |
| 2. Accounts receivable and other current assets (line 215 + line 240 + line 270) | DZ | |
| 3. Inventories and costs (p. 210 - p. 215 + p. 220) | ZZ | |
| Total current assets (current assets) (line 290 - line 230) | OA | |
| 4. Immobilized funds (non-current assets) (p. 190 + p. 230) | VA | |
| Total assets (property) (p. 300) | NVA | |
| Passive | ||
| 1. Accounts payable and other short-term liabilities (line 620 + line 630 + line 650 + line 660) | short circuit | |
| 2. Short-term loans and borrowings (p. 610) | QC | |
| Total short-term borrowed capital (short-term liabilities) (line 690 - line 640) | KO | |
| 3. Long-term borrowed capital (long-term liabilities) (p. 590) | BEFORE | |
| 4. Own capital (p. 490 + p. 640) | SK | |
| Total liabilities (capital) (p. 700) | SVK |
In the analytical balance, the general balance model is preserved: SVA = SVK or DS + DZ + ZZ + VA = KZ + KK + DO + SK.
Let's consider the stages of balance sheet analysis.
First stage. Analysis of balance dynamics and structure
During the analysis, it is advisable to determine the growth rate of the most significant items (groups) of the balance sheet and compare the results obtained with the growth rate of sales revenue.
An important area of analysis is vertical analysis of the balance sheet, during which the share and structural dynamics of individual groups and items of assets and liabilities of the balance sheet are assessed.
A “good” balance satisfies the following conditions:
- the balance sheet currency at the end of the reporting period increases compared to the beginning of the period, and its growth rate is higher than the inflation rate, but not higher than the revenue growth rate;
- other things being equal, the growth rate of current assets is higher than the growth rate of non-current assets and short-term liabilities;
- the size and growth rate of long-term sources of financing (equity and long-term debt capital) exceed the corresponding indicators for non-current assets;
- the share of equity in the balance sheet currency is not lower than 50%;
- the size, share and growth rate of receivables and payables are approximately the same;
- There are no uncovered losses on the balance sheet.
When analyzing the balance sheet, changes in accounting methodology and tax legislation, as well as the provisions of the organization’s accounting policies, should be taken into account.
Vertical and horizontal analysis of financial statements
Horizontal and vertical analysis are necessary to maintain a stable position of the organization. Banks, investors and lenders often resort to such analysis to assess and minimize financing risks.
Vertical (structural)
the analysis shows changes in balance sheet items and allows you to see what happened to the company’s accounts receivable and payable, and working capital compared to previous years. Assess whether the condition of the enterprise has improved or worsened. The final balance sheet data structures are presented as individual values. And reporting items are given as a percentage of its total.
The sum of assets (in the balance sheet) and revenue (in the analysis of the financial structure) with a vertical balance sheet is taken as 100%. Each further item must be presented as a percentage of the base value.
To calculate the percentage, you need to divide each line of the analyzed year by the balance sheet currency and multiply by 100. An example of a balance sheet is shown in Table 1.
Table 1. Vertical analysis of the balance sheet (example).
| No. | Enterprise balance sheet | Indicator values | Vertical analysis | |||
| 01.01.2017 | 01.01.2018 | 01.01.2017 | 01.01.2018 | |||
| ASSETS | 775 600 | 810 400 | 100 % | 100% | ||
| 1. | Working capital | 450 110 | 512 800 | 58,03% | 63,28 % | |
| 1.1. | Inventory | 51 000 | 45 300 | 6,57% | 5,59% | |
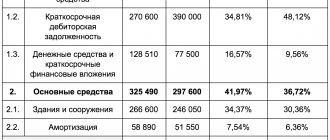
| 1.2. | Short-term receivables | 270 600 | 390 000 | 34,81% | 48,12% | |
| 1.3. | Cash and short-term financial investments | 128 510 | 77 500 | 16,57% | 9,56% | |
| 2. | Fixed assets | 325 490 | 297 600 | 41,97 % | 36,72% | |
| 2.1. | Buildings and constructions | 266 600 | 246 050 | 34,37% | 30,36% | |
| 2.2. | Depreciation | 58 890 | 51 550 | 7,54% | 6,36% | |
| PASSIVE | 771 100 | 809 300 | 100% | 100% | ||
| 3. | Equity | 373 900 | 448 500 | 48,49% | 55,42% | |
| 4. | Long-term debt | 100 700 | 94 500 | 13,06% | 11,68% | |
| 5. | Short-term debt | 296 500 | 266 300 | 38,45% | 32,86% | |
For example, if working capital as of 01/01/2017 is 450,110. This amount must be divided by the balance sheet currency 775,600 and multiplied by 100. It turns out that the figure is 58.03%. The percentage as of 01/01/2018 is calculated in the same way. It will be equal to 63.28%. It follows from this that, compared to the previous year, current assets increased by 5.25%.
The growth of the working capital indicator was influenced by accounts receivable. We need to find out why it is growing. Early debt has decreased, the share of equity capital is within 50% of liabilities, which means the level of stability of the organization is average.
Horizontal analysis allows you to trace changes that have occurred over previous years. Evaluate whether the result is positive or negative.
You need to take any two or three periods (years or quarters) and compare the values of absolute and relative indicators. The former have a monetary value, while the latter have a percentage value. See table 2.
Table 2. Horizontal analysis of the financial statements of an enterprise (example).
| No. | ASSETS | Indicator values | Horizontal analysis | |||
| 01.01.2017 | 01.01.2018 | Absolute change | Relative change, % | |||
| ASSETS | 775 600 | 810 400 | 34 800 (810 400 — 775 600) | 4,49 (34,800/810,400) x 100 | ||
| 1. | Working capital | 450 110 | 512 800 | 62 690 | 13,93 | |
| 1.1. | Inventory | 51 000 | 45 300 | — 5700 | — 11,18 | |
| 1.2. | Short-term receivables | 270 600 | 390 000 | 119 400 | 44,12 | |
| 1.3. | Cash and short-term financial investments | 128 510 | 77 500 | — 51 010 | — 39,69 | |
| 2. | Fixed assets | 325 490 | 297 600 | — 27 890 | — 8,57 | |
| 2.1. | Buildings and constructions | 266 600 | 246 050 | — 20 550 | — 7,71 | |
| 2.2. | Depreciation | 58 890 | 51 550 | — 7 340 | — 12,46 | |
| PASSIVE | 771 100 | 809 300 | 38 200 | 4,95 | ||
| 3. | Equity | 373 900 | 448 500 | 74 600 | 19,95 | |
| 4. | Long-term debt | 100 700 | 94 500 | — 6200 | — 6,16 | |
| 5. | Short-term debt | 296 500 | 266 300 | — 30 200 | — 10,18 | |
The table shows that during the year accounts receivable increased by 44%.
Horizontal and vertical analysis can be used comprehensively, since they complement each other.
Second phase. Analysis of the financial stability of the organization
Absolute indicators of financial stability:
- availability of real equity capital (net assets);
- Availability of own working capital and net working capital.
Relative indicators of financial stability are the coefficients of financial stability (financial structure of capital).
System of main indicators for analyzing financial stability:
- Own working capital (own working capital): SOS = SK - VA
- Net working capital: NSC = SK + DO - VA or NSC = OA - KO
- Net assets: NAV (the calculation procedure is established by a letter from the Ministry of Finance of Russia and the Federal Securities Commission. The analytical balance presented above is formed so that NC = NAV)
- Autonomy coefficient (financial independence, concentration of equity capital): kavt = SC / SVK
- Financial dependence coefficient (debt capital concentration): kfz = ZK / SVK, where ZK = KO + DO
- Debt to equity ratio (financial leverage ratio): KZS = ZK / SK
- Preservation ratio of equity capital: kks = SKk.p. / SKn.p.
- Maneuverability (mobility) coefficient of equity capital: kskm = SOS / SK
- Provision ratio of own working capital (net working capital): cos = SOS / OA
How to assess the financial condition of an enterprise
To begin with, an initial assessment of the company's position is carried out. For this, two main reporting forms are used - Balance Sheet and Profit and Loss Statement.
Take our proprietary course on choosing stocks on the stock market → training course
At this stage, changes in the size of property and its sources that have occurred over the year are simply stated, and relationships between the lines of reporting forms are identified.
The so-called express analysis also involves the calculation of the most indicative values that allow us to draw conclusions about the position of the company, as well as the dynamics of its development. Such indicators, in particular, include:
- The security of the assets on the company's balance sheet with its own property: the difference between the result of the first section of the liability side of the balance sheet (sources of property) and the first section of the asset side of the balance sheet (the actual value of fixed assets and non-current assets);
- The amount of immobilized working capital (in particular, the amount of receivables is considered);
- The provision of actual material property with sources of its formation;
- Solvency of the company (the ability to quickly pay off urgent debts, which is determined by the presence of sufficient amounts in current accounts and the absence of overdue debts to creditors).
Also, when assessing the financial condition, the coefficients of financial stability and liquidity are necessarily studied.
Liquidity is the ability of a company to pay debts to creditors in a fairly short time by selling working capital (in this case, violation of deadlines is acceptable).
Analysts use the following three liquidity measures.
1. Current liquidity (coverage ratio) is a value demonstrating the sufficiency (or lack) of the enterprise’s assets to pay short-term debts during the year. The indicator is calculated using the following formula:
Current assets: Short-term liabilities
2. Quick liquidity (“critical assessment”) - the indicator reflects the ability of the enterprise to repay urgent debts with the liquid part of the property. Those that are not so easy to sell (for example, inventories) are excluded from liquid assets. The formula looks like this:
Liquid assets: Short-term liabilities
3. Absolute liquidity - this indicator provides information about the amount of debt that can be paid immediately with the company’s maximum liquid funds (that is, money). The value is calculated as follows:
(Money in accounts and on hand + short-term financial investments): Short-term liabilities
Financial stability indicators are included in a special group.
In practice, the following are most often calculated:
- Autonomy coefficient (Equity: Total capital) - shows what part of accounts payable can be reimbursed with one’s own funds and should normally exceed 50%;
- Dependency coefficient (Total capital: Equity capital) is the inverse of the autonomy coefficient, showing the participation of borrowed funds in ensuring the functioning of the company;
- Gearing Ratio (Liabilities: Equity);
- Investment coverage ratio ((Equity capital + Long-term liabilities) : Total capital);
- The ratio of coverage of current assets with own working capital, showing what part of these assets is covered by own property (Own property: Current assets);
- The coefficient of provision of the MPZ with its own property, showing the degree of independence of the MPZ from borrowed funds (Own property: MPZ).
Important!
All indicators characterizing the financial condition of the company are calculated at the beginning and end of the year. They are compared both in dynamics and with standard values. Based on the results of such an analysis, conclusions are drawn about the prospects for the company’s development given existing trends, the reasons that caused the changes, and problems are identified that interfere with maximizing profits and increasing the risks of a financial crisis.
| Business valuation | Financial analysis according to IFRS | Financial analysis according to RAS |
| Calculation of NPV, IRR in Excel | Valuation of stocks and bonds |
Third stage. Analysis of balance sheet liquidity and solvency of the enterprise
Balance sheet liquidity means the presence of working capital in an amount potentially sufficient to pay off short-term obligations. Balance sheet liquidity is the basis of the organization's solvency. Balance sheet liquidity can be assessed using various methods, including based on the calculation of basic liquidity ratios. The calculation of each of the coefficients includes certain groups of current assets that differ in the degree of liquidity (i.e., the ability to be transformed into cash during the production and commercial cycle).
Example of analysis of balance sheet liability items
It is most convenient to consider the analysis of passive balance sheet items using an example.
Example. The results of the functioning of CONTINENT LLC are as follows.
| Article title | For the beginning of the year | Specific gravity | At the end of the year | Specific gravity | Change in value | Share change |
| ||||||
| Authorized capital | 9,95 | 0,09 | 10,61 | 0,1 | + 0,66 | + 0,01 |
| retained earnings | 20,92 | 0,2 | 22,39 | 0,22 | + 1,47 | + 0,02 |
| Total for the section | 30,87 | 0,3 | 33 | 0,33 | +2,13 | +0,03 |
| ||||||
| Loans and credits | 2,48 | 0,02 | 5,63 | 0,05 | + 3,15 | + 0,03 |
| Total for the section | 2,48 | 0,02 | 5,63 | 0,05 | + 3,15 | + 0,03 |
| ||||||
| Debt to creditors, including: | 69,83 | 0,68 | 65,21 | 0,63 | — 4,62 | — 0,05 |
| suppliers | 59,07 | 0,57 | 57,33 | 0,55 | — 1,74 | — 0,02 |
| staff | 5,42 | 0,05 | 2,66 | 0,03 | — 2,76 | — 0,02 |
| Tax office and funds | 4 | 0,04 | 3,2 | 0,03 | — 0,8 | — 0,01 |
| Other creditors | 1,34 | 0,01 | 2,02 | 0,01 | — 0,68 | — |
| Total for the section | 69,83 | 0,68 | 65,21 | 0,63 | — 4,62 | — 0,05 |
| Balance | 103,18 | 103,84 |
The table shows that in absolute terms the amount of equity capital has increased. His share in the total property of the company also increased. There was an increase in long-term borrowings in the same proportions.
But the size of short-term liabilities has decreased significantly (mainly due to debt items to suppliers and personnel).
In general, the current situation is assessed positively: the financial stability and independence of the company is growing, borrowed funds with a long repayment period are being attracted into circulation in order to expand the activities of the LLC and maximize profits.
Fourth stage. Asset condition analysis
As part of the analysis of the balance sheet, it is necessary to analyze the composition, structure and efficiency of use of non-current and current assets.
To assess the effectiveness of current assets, profitability and turnover indicators are used. To assess working capital turnover in general, the following indicators can be recommended:
- Working capital turnover ratio: kob = N / OA avg, where N is sales revenue; OA avg is the average value of current assets.
- Period of turnover of working capital: Po = OA av * D / N, where D is the number of days in the analyzed period.
An analysis of the dynamics, composition and structure of non-current assets on the balance sheet should be complemented by an analysis of fixed assets.
The concept of liabilities on the balance sheet of an enterprise
The liability side of the balance sheet is that part of Form No. 1, which reflects the sources of formation of property. This includes the company's liabilities and its capital.
Passive sections
The passive part of the form includes three sections. They are described below.
| Section number | Name | Content |
| I | Capital and reserves | Here you can find information about the share capital (the initial contribution of the founders), additional and reserve funds (created during the operation of the company), profit (loss). |
| II | long term duties | Fee-based loans provided to the company for a long term (that is, for a period longer than one year). |
| III | Short-term liabilities | Short-term debts to counterparties of various types: the tax office and government funds, own employees, suppliers, credit institutions, etc. Usually, by the end of the year, enterprises try to pay off this type of debt, so often there are no amounts in the annual balance sheet for the corresponding lines. |
Liability accounts
The liabilities side of the balance sheet presents the totals for the following groups of accounts:
- Active-passive: 60, 62, 68, 69, 71, 75, 76, 84, 90, 99;
- Passive: 66, 70, 80, 98.
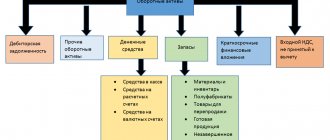
Composition and structure of capital (liabilities) - diagram
The diagram shows the composition of the liabilities side of the balance sheet. During analytical activities, special attention is paid to the proportions of equity and debt capital.
Having a sufficient amount of own funds ensures the financial stability of the company. At the same time, it is inappropriate to finance activities exclusively from your own sources - this way you can miss out on many benefits. For example, the fee for using borrowed funds may be much lower than the profit that the enterprise will receive from investing in the business.
Therefore, finding the optimal ratio between equity and debt capital (as well as between short-term and long-term liabilities) is an important task for managers and analysts.
Fifth stage. Business activity analysis
An assessment of business activity can be carried out in the following areas:
1. according to the level of efficiency of resource use (the level and dynamics of capital productivity, labor productivity, profitability and other indicators). The most important in this group are asset and capital turnover indicators;
2. according to the ratio of growth rates of profit, turnover and advanced capital. Business activity is characterized positively if the ratio is observed:
TRPDN > TR N > TRSVK > 100%,
where TRPDN is the growth rate of profit before tax (or before taxes and interest); TP N - turnover growth rate (sales revenue); TRSVK is the growth rate of advanced capital (balance sheet currency).
Dependency means:
- the economic potential of the enterprise is growing (the scale of activity is increasing);
- sales volume increases at a faster rate compared to the growth of advanced capital, i.e. enterprise resources are used more efficiently;
- profits are growing at a faster pace, which indicates a relative reduction in costs. This ratio is called the “golden rule of enterprise economics.”
3. according to special indicators characterizing business activity (coefficients of sustainability of economic growth, self-financing ability, investment activity).
Comparative analytical balance
3
1.
Methodology for constructing a comparative analytical balance
Balance analysis is carried out using one of the following methods:
* analysis directly from the balance sheet without first changing the composition of balance sheet items;
* by constructing a consolidated comparative balance sheet with the aggregation of some elements of balance sheet items that are homogeneous in composition;
* implementation of additional balance sheet adjustments for the inflation index with subsequent aggregation of items in the necessary economic sections. A comparative analytical balance can be obtained from the original balance sheet by condensing individual items and supplementing it with indicators of structure, dynamics and structural dynamics.
The analytical balance sheet is useful in that it brings together and systematizes the calculations that an analyst usually makes when reading a balance sheet. The analytical balance sheet usually covers a lot of important indicators that characterize the statics and dynamics of the financial condition of the organization. This balance actually includes indicators of both horizontal and vertical analysis. Directly from the analytical balance sheet you can obtain a number of the most important characteristics of the financial condition of the organization. These include:
total value of the organization's property reflected
in the final line of the balance sheet;
the cost of immobilized (non-current) assets, equal to the total of section I of the balance sheet;
the cost of mobile (working) funds equal to the total of section II of the balance sheet;
cost of material working capital (inventories);
the amount of the organization’s own funds equal to the total of section III of the balance sheet;
the amount of borrowed funds equal to the sum of the results of sections IV and V of the balance sheet;
the amount of own working capital equal to the difference in the results of sections III and I of the balance sheet;
A separate position in the aggregated balance sheet shows net working capital, defined as the part of current assets (working capital) financed by invested capital. The value of this indicator characterizes the degree of liquidity of the enterprise, which makes this indicator of particular importance.
This work is not unique. It can be used as a base to prepare for your project.
Typically, net working capital (NWC) is calculated using the formula
CHOC = TA – TP,
where TA are current (current) assets,
TP - current (short-term) liabilities.
The greater the net working capital, the more financially stable the enterprise.
When analyzing the comparative balance sheet, it is necessary to pay attention to the change in the share of the amount of own working capital in the value of the property, to the ratio of the growth rates of equity and borrowed capital, as well as to the ratio of the growth rates of receivables and payables.
With stable financial stability, the organization should increase in dynamics the share of its own working capital, the growth rate of equity capital should be higher than the growth rate of borrowed capital, and the growth rate of receivables and payables should balance each other.
Horizontal balance sheet analysis
consists in constructing one or more analytical tables in which absolute balance sheet indicators are supplemented with dynamics indicators. The degree of aggregation of indicators is determined by the analyst.
Table
1.
| Horizontal | balance sheet asset analysis | |||
| Asset items | To the beginning | Finally | Changes (+,-) | |
| year, thousand rubles | year, thousand rubles | in thousand rubles | V% | |
| A | 1 | 2 | 3 | 4 |
| Non-current assets – total, including: | 12251 | 14507 | +2256 | +18,41 |
| Intangible assets | – | – | – | |
| Fixed assets | 11550 | 14345 | +2795 | 24,20 |
| Construction in progress | 678 | 63 | -615 | -90,71 |
| Profitable investments in material assets | – | – | – | – |
| Long-term financial investments | 23 | 23 | – | – |
| Deferred tax assets | – | 76 | +76 | – |
| Other noncurrent assets | – | – | – | – |
| Current assets – total, including | 30294 | 45292 | +14998 | +49,51 |
| Reserves | 24551 | 31605 | +7054 | +28,73 |
| VAT on purchased assets | 373 | 564 | +191 | +51,21 |
| Long-term accounts receivable | – | – | – | – |
| Short-term receivables | 3884 | 8487 | +4603 | + 118,51 |
| Short-term financial investments | 261 | – | -261 | -100,0 |
| Cash | 1225 | 4636 | +3411 | +278,45 |
| Other current assets | – | – | – | – |
| Total assets | 42545 | 59799 | +17254 | +40,55 |
Based on the table below. 1 we can conclude the following. The total value of the organization's property increased during the reporting year by 17,254 thousand rubles, or 40.55%. Current assets increased during the period to a greater extent than non-current assets.
The least mobile part of current assets—inventories—increased most significantly in absolute terms, and in relative terms—cash. There is a fairly significant increase in accounts receivable - by 4603 thousand rubles, or 118.51%. This fact reflects the diversion of part of current assets to lending to consumers of finished products, goods, works and services of the organization, subsidiaries and other debtors, which indicates the actual immobilization of this part of working capital from the production process. On the other hand, accounts receivable indicate the upcoming receipt of funds if the organization has solvent debtors.
Non-current assets during the reporting period increased by 2256 thousand rubles, or 18.41%. The increase in the value of non-current assets occurred due to an increase in the value of fixed assets and the formation of deferred tax assets.
The decrease in value occurred under the items “Construction in progress” and “Short-term financial investments”.
Table 2.
Horizontal analysis of balance sheet liabilities.
| Liability items | At the beginning of the year, thousand rubles. | At the end of the year, thousand rubles. | Changes (+,-) | |
| in thousand rubles | V% | |||
| A | 1 | 2 | 3 | 4 |
| Capital and reserves – total, including: | 39841 | 52212 | +12371 | +31,05 |
| Authorized capital | 13046 | 13046 | – | – |
| Own shares purchased from shareholders | – | – | – | – |
| Extra capital | 221 | 221 | – | – |
| Reserve capital | 913 | 914 | +1 | +0,11 |
| Retained earnings (uncovered loss) | 25661 | 38031 | +12370 | +48,21 |
| Long-term liabilities – total, including | – | 469 | +469 | – |
| Loans and credits | – | – | – | – |
| Deferred tax liabilities | – | 469 | +469 | – |
| Other long-term liabilities | – | – | – | – |
| Short-term liabilities - everything, including | 2704 | 7118 | +4414 | +163,24 |
| Loans and credits | – | – | – | – |
| Accounts payable | 2692 | 4740 | +2048 | +76,08 |
| Debt to participants for payment of income | 12 | 2378 | +2366 | + 19716,67 |
| revenue of the future periods | – | – | – | – |
| Reserves for future expenses | – | – | – | – |
| Other current liabilities | – | – | – | – |
| Total liabilities | 42545 | 59799 | +17254 | +40,55 |
As follows from the calculations presented in table. 2,
the increase in the value of liabilities for the reporting period by 17,254 thousand rubles, or 40.55%, was mainly due to an increase in equity capital by 12,371 thousand rubles, or 31.05%. Long-term liabilities over the same period increased by 469 thousand rubles, and short-term liabilities by 4414 thousand rubles. (163.24%).
The growth of equity capital was due to an increase in retained earnings in the amount of RUB 12,370 thousand. The authorized, additional and reserve capital did not change in absolute amounts.
Among borrowed funds, the debt to participants for payment of income increased most significantly - by 2,366 thousand rubles. and accounts payable - by 2048 thousand rubles, or 76.08%. The growth of accounts payable is offset by an increase in cash, which is a positive trend in the development of the enterprise.
The next analytical procedure is vertical analysis
— presentation of the financial report in the form of relative indicators. This representation allows you to see the share of each balance sheet item in its overall total. An obligatory element of the analysis is the dynamic series of these quantities, through which it is possible to track and predict structural changes in the composition of assets and the sources of their coverage. Thus, two main features of vertical analysis can be distinguished:
the transition to relative indicators allows for a comparative analysis of enterprises taking into account industry specifics and other characteristics;
relative indicators smooth out the negative impact of inflationary processes, which significantly distort the absolute indicators of financial statements and thereby complicate their comparison over time.
It should be noted that the importance of permanent and current assets for manufacturing and trading companies is different. Thus, a significant part of the assets of a production company will obviously be formed from fixed production assets. At the same time, the assets of a company engaged in trading activities will primarily consist of inventories, goods for resale and other property, which is reflected in the section “Current assets”. Thus, when analyzing the ratio of permanent and current assets, more attention should be paid to the change in structure itself, and, if possible, compare it with the structure of assets of peer companies and find out the reasons for the differences.
Table.3
Vertical analysis of balance sheet assets
| Asset items | Share at the beginning of the year, % | Share at the end of the year, % | Change in structure (+-) |
| A | 1 | 2 | 3 |
| Non-current assets – total, including: | 28,80 | 24,26 | -4,54 |
| Intangible assets | – | – | – |
| Fixed assets | 27,15 | 23,99 | -3,16 |
| Construction in progress | 1,59 | 0,11 | -1,48 |
| Profitable investments in material assets | – | – | – |
| Long-term financial investments | 0,05 | 0,04 | -0,01 |
| Deferred tax assets | – | 0,13 | +0,13 |
| Other noncurrent assets | – | – | – |
| Current assets – total, including | 71,20 | 75,74 | +4,54 |
| Reserves | 57,71 | 52,85 | -4,86 |
| VAT on purchased assets | 0,88 | 0,94 | +0,06 |
| Long-term accounts receivable | – | – | – |
| Short-term receivables | 9,13 | 14,19 | +5,06 |
| Short-term financial investments | 0,61 | – | -0,61 |
| Cash | 2,88 | 7,75 | +4,87 |
| Other current assets | – | – | – |
| Total assets | 100 | 100 | 0 |
Both at the beginning and at the end of the reporting period, current assets occupy a larger share of property than non-current assets. During the reporting year, their share increased by 4.54 points, which indicates the formation of a more mobile asset structure.
Table
4
Vertical analysis of balance sheet liabilities
| Liability items | Specific gravity at the beginning of the year, % | Share at the end of the year, % | Change in structure (+,-) |
| A | 1 | 2 | 3 |
| Capital and reserves – total, including: | 93,64 | 87,31 | -6,33 |
| Authorized capital | 30,66 | 21,82 | -8,84 |
| Own shares purchased from shareholders | * | – | – |
| Extra capital | 0,52 | 0,37 | -0,15 |
| Reserve capital | 2,15 | 1,53 | -0,62 |
| Retained earnings (uncovered loss) | 60,31 | 63,60 | +3,29 |
| Long term duties - everything, including | 0,78 | +0,78 | |
| Loans and credits | – | – | – |
| Deferred tax liabilities | – | 0,78 | +0,78 |
| Other long-term liabilities | – | – | – |
| Short-term liabilities - everything, including | 6,36 | 11,90 | +5,54 |
| Loans and credits | – | – | – |
| Accounts payable | 6,33 | 7,93 | +1,6 |
| Debt to participants for payment of income | 0,03 | 3,98 | +3,95 |
| revenue of the future periods | – | – | – |
| Reserves for future expenses | – | – | – |
| Other current liabilities | – | – | – |
| Total liabilities | 100 | 100 | 0 |
From the table Figure 4 shows that the organization’s liabilities are dominated by equity capital. By the end of the year, there was a tendency towards a slight reduction in its share.
In the process of analysis, special attention must be paid to the elements that have the greatest share, and the elements whose share has changed abruptly. As a rule, elements with the maximum specific weight or those that change abruptly are indicators of the “problem points” of the organization. To obtain more accurate information, it is necessary to estimate the absolute values of these elements.
Based on the results of the balance sheet analysis as a whole, we can conclude the following. An analysis of structural dynamics indicators revealed the presence of a rather favorable trend: 86.92% of the total increase in property was achieved through an increase in current assets. Thus, newly attracted financial resources were invested mainly in more liquid assets, which strengthens the financial stability of the organization. The greatest influence (71.7%) on the increase in sources of funds was exerted by the increase in equity capital.
Horizontal and vertical analysis complement each other. Therefore, in practice, it is advisable to build analytical tables that characterize both the structure of the reporting accounting form and the dynamics of its individual indicators.
Trend analysis
- part of the long-term analysis that is necessary in managing the financial resources of an organization. In the process of trend analysis, a graph of the organization’s possible development is constructed, the average annual growth rate is determined, and the forecast value of each indicator is calculated. This is the simplest way of financial forecasting. The exclusion of random deviations makes it possible to identify stable dynamic series of individual indicators, which can serve as a fairly reliable basis for predicting the development of business entities.
Analysis of the dynamics of the balance sheet currency, the structure of assets and liabilities of the organization allows us to draw a number of important conclusions necessary both for the implementation of current financial and economic activities and for making management decisions for the future.
In general terms, signs of a “good” balance are:
the balance sheet currency at the end of the reporting period increased compared to the beginning;
the growth rate of current assets is higher than the growth rate of non-current assets;
The organization's own capital exceeds its borrowed capital and its growth rate is higher than the growth rate of borrowed capital;
The growth rates of accounts receivable and accounts payable are approximately the same.
2.
Analysis of the “quality” of receivables
Receivables reflect the amount of debt to the company from various legal entities and individuals who have direct relationships with the company.
The amount of accounts receivable is, as a rule, influenced by two main factors:
1) the level of business activity of the enterprise - the greater the sales volume, the usually greater the volume of accounts receivable;
2) the attitude of the enterprise towards its customers - the more the enterprise provides a deferred payment, wanting to retain existing customers and attract new ones, the greater the volume of receivables.
The assessment of receivables begins with a study of its composition and structure. Dividing accounts receivable into long-term and short-term is important when analyzing the structure of an enterprise's assets and their turnover.
Cash discounting is used to analyze long-term debt.
Some of the work is hidden to preserve uniqueness. Register and receive fragments + free estimate of the cost of unique work by email.
streams. Discounting allows you to take into account the time value of funds, i.e. the possibility of their short-term use, whether discounts and other conditions in favor of the consumer (for example, his right to return products) were taken into account.
It is important to study indicators of the quality and liquidity of receivables.
Quality refers to the likelihood of receiving this debt in full. The probability indicator is the period of debt formation, as well as the share of overdue debt. As a rule, the longer the term of the receivable, the lower the likelihood of collection.
To assess the authenticity and possibility of actually receiving receivables, the analyst also needs to have an idea of the contracts the company concludes for the sale of its products (goods, works, services). For example, the contract may provide for the buyer's right to return the goods within a certain period.
To assess the turnover of accounts receivable (funds in settlements), turnover indicators are used, calculated using the formulas
Turnover ratio _
Revenue from sales
of receivables
Average balances of receivables
Average receivables are calculated using the arithmetic average formula: half the amount at the beginning of the year plus half the amount at the end of the year.
Average repayment period
__
Calendar days of the receivables turnover ratio of receivables
3.
Check the analysis of changes in the cash balance according to Form No. 4 “ Cash ”
Solution
During the reporting period, the cash balance amounted to 2165 thousand rubles, which is 2066 thousand rubles. more than last year.
| Index | ? for the beginning of the year | ? at the end of the year | Deviation |
| Net money funds from current activities. | 6208 | 2398 | 3810 |
| Net money funds from investment activities. | __ | (502) | __ |
| Net money funds from financial activities. | (4142) | (2932) | (1210) |
| Remaining money Funds at the end of the reporting period. | 2165 | 99 | 2066 |
This change was influenced by an increase in net cash from operating activities
by 3810 thousand rubles. including:
From funds received from buyers, customers for 17926 thousand rubles.
From other income by 4472 thousand rubles.
From funds allocated to:
To pay for purchased goods, works, services, raw materials and other current assets 7511 thousand rubles.
For labor costs 519 thousand rubles.
Cash allocated for the payment of dividends and interest decreased by 1,178 thousand rubles, which had a positive effect on the change in cash. funds.
For settlements of taxes and fees 4898 thousand rubles.
For other expenses 2166 thousand rubles.
Cash flow from investing activities
the organization did not carry out any activities during the reporting period, because in the previous year, net money. the funds brought a loss of -502 thousand rubles.
The company has a loss from financial activities, net money. funds amounted to (4142) thousand rubles, including:
Receipts from loans and credits provided by other organizations - 21,101 thousand rubles.
Repayment of loans and credits - 1989 thousand rubles.
Net increase in cash and cash equivalents RUB 3,102 thousand.
4.
Assess the liquidity of the balance sheet using the liquidity ratio.
To abs. face = A1/P1+P2
To abs. l.= 2264+500/50364+15950 = 0.041
To the cr. lic.= A1+A2/P1+P2
To the cr. l.= 2264+500+78657/50364+15950 = 1.231
To current lic.= A1+A2+A3/P1+P2
To current face = 2764+78657+85565+1833/50364+15950 = 2.545
| Assets | ? | Passive | ? | |
| A1 | 2764 | ? | P1 | 50364 |
| A2 | 78657 | ? | P2 | 15745 |
| A3 | 87398 | ? | P3 | 820 |
| A4 | 201349 | ? | P4 | 303034 |
| Total | 370168 | Total | 370168 |
Purpose
Carrying out a comparative balance sheet analysis allows you to obtain information and data in the following areas:
- Calculation of the value of current and non-current assets, as well as sources of their financing: analytics of dynamics and structure.
- Determination of balance sheet items with rapid growth rates.
- Structural share of assets in terms of accounts receivable and inventory.
- Separation of liabilities according to the degree of urgency of payments.
- Calculation of the share of the company's own resources
When conducting such an analysis, special attention is paid to those elements that occupy the maximum or largest share in the structure. Special consideration is given to those items that are also sharply increasing or decreasing.
Carrying out analysis using horizontal and vertical techniques makes it possible to assess and establish the size and dynamics of the company’s property and its individual elements.
Ways to improve your balance sheet structure
It is almost impossible to create a perfect balance sheet for a company. For this purpose, an analysis of the financial condition of the enterprise is carried out. In the process of compiling it, negative trends that require improvement are always identified. Let's consider the most typical possible ways to improve the structure of the comparative analytical balance. Among these areas are:
- Use of specialized computer programs to ensure automation of the company's accounting processes.
- Bringing existing Russian accounting standards closer to international standards.
Existing shortcomings in the area of improving information support for balance users are associated with the use of modern automation tools. The main task is to optimize the company's information flows in terms of accounting information and towards the use of international standards, a reasonable system of classification, coding and data processing. This also includes the development of forms and methods of accounting in accounting, the use of computerization and modern software.
The introduction of automation processes makes it possible to improve the algorithm for calculating indicators when drawing up an analytical balance and conducting its analysis, and improve the quality of economic information.
It should be noted that the use of automation also makes it possible to reduce the time for receiving and processing operational accounting information about the state of balance sheet items and business assets.
Vertical analysis
Despite the fact that the purpose of vertical analysis is similar to the purpose of horizontal analysis, there are a number of differences in the methodology for conducting them.
If horizontal analysis operates with absolute indicators, then when conducting vertical analysis it is necessary to use relative indicators. Thus, when it is carried out, individual elements of the balance sheet are considered as part of the group, for example, inventories or receivables in the structure of working capital, loans in the structure of short-term liabilities. The analysis process reveals the structural relationship between the individual elements of the balance sheet items in relation to the total value of the asset or liability.
Further, based on the results of the identified structural shares of individual elements of the analytical balance, the method of horizontal analysis can be applied. This point consists of tracking dynamic processes in the structure. For example, having identified the share of accounts payable in the liability structure, at the next stage you can consider how this share has changed over the course of two to three years in the company.