What is return on total capital?
Return on total capital is a financial indicator that reflects how profitable investments in its assets are for an enterprise. Moreover, these investments are formed at the expense of total capital - both own and borrowed. This is precisely why the indicator under consideration is called “return on total capital”.
To calculate return on total capital, you need to use the formula:
RSK = F2300 / BSR1600,
where: RSC - return on total capital;
F2300 - line 2300 of the financial results report (profit before tax).
The BSR1600 indicator is defined as:
BSR1600 = (B1600 (NP) + B1600 (KP)) / 2,
where: B1600 (NP) - indicator in line 1600 of the balance sheet (all assets) at the beginning of the period;
B1600 (KP) - indicator in line 1600 at the end of the period.
Return on total equity is very similar to return on assets.
Let's study its features.
Formula and example
The formula expresses the amount of funds raised by the company to generate a ruble of profit:
RSK = PE / STKo * 100 , where:
- RSC – return on total capital;
- PE – net profit;
- STCo is the total cost of capital.
The material for calculations is taken from the financial statements. Net profit is line 2400 of the financial report. results, and the total cost of capital is line 1600 of the balance sheet, i.e. total assets.
The total cost of capital, or assets, as already mentioned, can be calculated using the average value for the period: RSK = PE / (STKoNP + STKoKP) * 1/2, where STKoNP and STKoKP, respectively, assets at the beginning and end of the period on page 1600 Profitability is traditionally expressed as a percentage (the result is multiplied by 100).
Example (conditional data). Let's calculate the return on total capital based on the average value of total capital for the period. Let the profit minus taxes (net profit) be equal to 55,000 rubles. At the beginning of the period, the amount of assets is 390,000 rubles, at the end of the period - 380,000 rubles. Average total capital: (390,000 + 380,000) * 1/2 = 385,000 rub. RSC = 55000 / 385000 * 100 = 14.29%.
This data can be used both for internal analysis and for external analysis: take for comparison data for another period of the company’s operation or compare them with those calculated for another company in the same market segment.
The concept of “normal indicator value” is not used. First of all, changes in value and trends identified through calculations are taken into account. An increase in the indicator is usually associated with an increase in the efficiency of the company, an increase in sales, and a decrease indicates inefficient use of assets.
If the industry or enterprise has established indicator standards, enshrined in local, industry documents, compare actual indicators with these standards. It should also be noted such a factor as comparison with return on equity (line 2400 of the report corresponds to the data on page 1300 of the balance sheet). Close values for total and equity capital indicate the ability to get by with a minimum of borrowed money when acquiring assets.
Return on assets: difference from DGC
Return on assets is calculated using the formula:
RA = F2400 / BSR1600,
where: RA - return on assets;
F2400 - value in line 2400 of the financial results report (net profit).
Thus, the fundamental difference between the RSK and RA indicators is that the numerator of the RSK formula contains a value reflecting profit before tax, and the numerator of the RA formula contains net profit.
What is the difference between these types of profits?
In fact it is minimal. Net profit is profit before tax, reduced by taxes, the amount of which is determined by the applicable taxation scheme. For example:
- with OSN it is 20% of the profit;
- under the simplified tax system - 6% of revenue or 15% of profit;
- for UTII - a fixed amount determined by a complex formula.
Thus, the RSK indicator is almost always greater than RA when analyzing the results of an enterprise’s economic activities for the same reporting period. If, for example, when considering RSK and RA at 2 enterprises of the same holding, it turns out that the RA indicator at the first is higher than RSK at the second, this may indicate a significantly more effective management scheme at the first enterprise and, as a result, become a factor for adoption owners of various organizational decisions for managing the second enterprise.
How can the value of the RSC indicator in its pure form be interpreted?
Current assets and balance sheet
In the balance sheet form, current assets are reflected on the following lines:
| Line | Type of current assets |
| 1210 | Reserves |
| 1220 | Value added tax on purchased assets |
| 1230 | Accounts receivable |
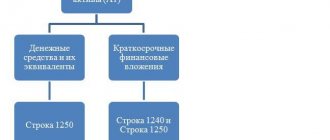
| 1240 | Financial investments (excluding cash equivalents) |
| 1250 | Cash and cash equivalents |
| 1260 | Other current assets |
At their core, current assets are assets classified as current on the balance sheet.
However, it must be taken into account that long-term receivables are also reflected in the balance sheet as part of current assets.
This debt is included in the final indicator of the value of current assets on the balance sheet, indicated on line 1200 “Total for Section II,” although it should be presented separately as part of current assets.
Thus, in order to exclude the amount of long-term receivables when calculating current assets on the balance sheet, it is necessary to subtract long-term receivables from the amount of current assets on line 1200 of the balance sheet.
Return on total capital: optimal value
In some cases, this value can be assessed by comparison with the normative one - established by local regulations for a particular enterprise or formed at the industry level and accepted as normative.
When assessing the results of an enterprise’s economic activities, the dynamics of return on total capital can also be analyzed. Its growth will be welcomed by those interested in business growth. A decrease (to a level below acceptable values) may become a factor for these individuals to make decisions about adjusting approaches to business management, aimed, in particular, at stimulating profits, which forms the F2300 indicator.
The assessment of the results of economic activities based on the RSC indicator, as a rule, is supplemented by an assessment based on another important indicator - return on equity capital, which is determined by the formula:
RSoK = F2400 / B1300,
where: RSoK - return on equity;
F2400 - indicator in line 2400 of the financial results report (net profit);
B1300 - indicator in line 1300 of the balance sheet (total equity capital).
If the RSC indicator approaches the RSoK value, this may indicate that the enterprise is able to effectively generate assets without attracting external borrowed capital. This can be positively assessed by business owners.
Results
Return on total capital reflects the profitability of investments generated from all sources in the assets of the company. Calculated according to the balance sheet and financial results report of the company.
You can familiarize yourself with other formulas for calculating profitability in business in the articles:
- “Determining return on equity (formula)”;
- “How to calculate product profitability?”.
You can find more complete information on the topic in ConsultantPlus. Free trial access to the system for 2 days.
1.1. Balance, its structure and basic concepts
This note was written as part of the master's course “Modern Management Accounting”.
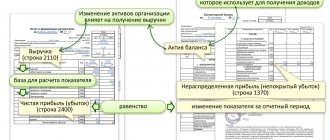
In business, there are three main financial documents from which managers draw data for further analysis: the balance sheet, the income statement, and the cash flow statement. The company's main reports are not independent, but are closely related to each other, forming a single reporting system (Fig. 1).
Rice. 1. The relationship between the three main accounting reports.
Download the note in Word format, examples in Excel format
The balance sheet is a snapshot of the assets that are used in a company and the capital that creates those assets. Balance is the economic embodiment of the law of conservation of energy: assets are not taken from nowhere, they arise due to an increase in capital. Consider liabilities as sources of capital, and assets as uses of capital. The two sides of a balance sheet are just two different ways of representing the same amount of money, i.e. information about where the money came from to the company and where it went (Fig. 2). In the future, we will very often use this property of the balance sheet - equality of assets and liabilities.
Rice. 2. Balance sheet, as information about sources of income and directions of use of capital
Assets (Fig. 3) are divided into non-current (fixed assets, intangible assets, long-term financial investments) and current (inventories, accounts receivable, cash on account and in cash, others). Capital is divided into equity (in Russian realities, this is usually the authorized capital + profit accumulated over the years of the company’s operation), long-term liabilities (loans taken for a period of more than a year), short-term liabilities (accounts payable; short-term loans; others, for example, accrued , but not paid, taxes, dividends, wages).
Rice. 3. Balance sheet structure.
Total assets = non-current assets + current assets; CA = BA + OA (1000 = 600 + 400) or on the right side of the balance sheet: total assets = capital = equity + long-term liabilities + short-term liabilities; SA = SK + DO + KO (1000 = 400 + 300 + 300)
Invested capital = non-current assets + current assets - short-term liabilities; IC = VA + OA – KO (700 = 600 + 400 – 300) or on the right side: invested capital = equity capital + long-term liabilities; IR = SC + DO (700 = 400 + 300)
Equity capital [in Russian reality] = authorized capital + accumulated profit, or through the left side of the balance sheet: equity capital = non-current assets + current assets – long-term liabilities – short-term liabilities; SC = VA + OA – KO – DO (400 = 600 + 400 – 300 – 300). The first formula is used by accounting. The second one reflects the essence: subtract all external liabilities from total assets (Fig. 4). Owner's capital is sometimes called share capital, as well as net capital.
Rice. 4. The ratio of total, invested and net capital.
Important. The degree of reliability of the equity indicator depends entirely on the reliability of the definition of assets.
Working capital = current assets – short-term liabilities; OK = OA – KO (100 = 400 – 300). Liquidity is the degree of availability of funds. Wealth and liquidity are not the same thing. If wealth is in assets that are difficult to convert into cash within a short time, wealth will be high and liquidity low. Another definition: working capital = equity capital + long-term liabilities - non-current assets; OK = SK + DO – VA (100 = 400 + 300 – 600). When a business first starts, long-term capital is poured into it, which is spent on fixed assets (FA), but some must remain to meet operational needs. As the business grows, working capital also grows; its financing is carried out from long-term sources (for example, from retained earnings). When drawing up business plans, a typical mistake is not taking into account working capital needs.
A balance sheet is rarely prepared as part of management accounting. In my opinion, this is due to the youth of the Russian market. Beginning businessmen place the main emphasis on cash flow, striving for their flow to be positive. Having “saddled” the cash, they begin to think about the management income statement. The pinnacle of financial management is the analysis of assets [using the balance sheet] (Fig. 5).
Rice. 5. Hierarchy of financial instruments of Russian management
Due to the above, Russian managers, as a rule, have a poor understanding of the balance sheet, and do not know how to draw it up or “read” it... In accounting, the balance sheet is the main document. Accountants are very good at preparing a balance sheet and understand its importance. Unfortunately, these differences result in managers and accountants speaking different languages, which further reinforces managers' disregard for the balance sheet.
In modern practice, the balance sheet is depicted not in a horizontal form (assets on the left, and capital on the right), but in a vertical form - assets at the top, capital at the bottom. Let's consider a typical balance sheet of a medium-sized company engaged in wholesale trade (Fig. 6).
Rice. 6. Example of a balance sheet for a wholesale trading company
Let's present this balance in a management form that is more convenient for analysis (Fig. 7).
Rice. 7. Simplified form of balance sheet (all figures in thousands of rubles)
Before reading further, study the balance numbers. What can you say about the company’s performance in 2010 compared to 2009?
Pay attention to:
- equality of assets and liabilities;
- a significant increase in the balance sheet currency, [1] which characterizes the growth of business volumes;
- “bad” growth in warehouse inventories and the volume of supplier invoices payable;
- the appearance of a short-term loan; Apparently, the company was unable to provide servicing of the increased working capital from its own funds;
- a fairly large volume of retained earnings, which increased shareholders' equity in 2010;
- significant increase in other accounts payable; Most likely, these are unshipped products based on received advance payments...
- accounts receivable in 2010 are significantly lower than the volume of accounts payable; this means that the company will not be able to pay suppliers until it sells a significant portion of its inventory.
Interesting? This is how much information can be gleaned from the balance sheet. In the following sections we will dwell in more detail on the analysis of the financial and economic activities of companies based on the balance sheet and profit and loss account.
See also:
- Fundamentals of corporate finance Balance sheet, its structure and basic concepts
- Gains and losses report
- Main financial indicators
- Financial leverage effect, balanced growth
- Behavior of costs when activity volumes change
[1] Balance sheet currency – the sum (total) for all component accounts of the balance sheet. This amount should be the same for the assets and liabilities of the balance sheet.