Hello, Vasily Zhdanov is here, in this article we will look at the most liquid assets on the balance sheet. Assets are structures, transport, equipment, warehouse stocks, money in accounts, etc. Thus, assets are that part of the accounting. balance sheet, which reproduces the composition of the property and its value as of a specific date. This is the generally accepted definition, which is the most common and is applied everywhere.
Meanwhile, there is another interpretation of the concept of “assets”, which can also be found quite often in “economic” usage. According to IFRS, this term refers to resources controlled by an enterprise that have arisen as a result of previous events and are expected to provide future economic benefit.
Take our proprietary course on choosing stocks on the stock market → training course
Assets, like liabilities, are subject to classification according to different criteria. Based on the book. balance sheet, then according to the currently used form No. 1, assets are either current or non-current.
Important! Today, enterprises, like all other organizations, except credit and government ones, use a new form of accounting. balance sheet (according to OKUD 0710001). It was introduced by Order of the Ministry of Finance of the Russian Federation No. 66n dated July 2, 2010 (as amended on April 19, 2019).
Current assets are money, money, accounts receivable, i.e., what is used every day in normal business activities. Non-current are assets withdrawn from a given economic turnover, i.e. they are located outside of it. These are, for example, fixed assets and long-term investments.
Turning again to current international standards, it is necessary (in relation to GAAP) to note three key factors characterizing assets. They are valid for the property of commercial structures:
- An organization can obtain and control the benefits from the assets it uses.
- The circumstances under which the right (control) over the acquired benefits was formed have already passed.
- The potential of the asset is used independently or in combination with other assets, which is a source of future economic benefit, since it directly or indirectly contributes to the increase in subsequent net cash flows.
In relation to other structures that do not set themselves the goal of obtaining such economic benefits, the third point does not apply.
Ranking of assets by degree of liquidity and comparing them with liabilities
Theoretical economics divides assets, among other things, according to their degree of liquidity. In this way, assets are systematized depending on their ability to be quickly sold at a market price or another value close to it. The ranking of assets into four groups along with examples is presented in the table below.
| Most (highly) liquid assets (A1) | Quickly liquid assets (A2) | Slowly liquid assets (A3) | Hardly liquid assets (A4) |
| Implemented in the shortest possible time (money, financial investments) | Can be implemented quickly enough (short-term accounts receivable) | Slowly, over a long period of time, they are converted into money (finished products, raw materials, long-term receivables) | Can be implemented with difficulty, difficult (standardly these are non-current assets) |
In economic analysis, assets grouped in this way are compared with groups of liabilities, which are also divided into 4 groups. For your information, liabilities are all the financial sources from which money is received by the company. There are: P1 (most urgent liabilities), P2 (short-term), P3 (long-term) P4 (permanent) liabilities. Thus, group P1 includes tax debt, group P2 includes prepayments from partners, P3 includes deferred tax liabilities, and group P4 includes own capital.
The groups of assets and liabilities are subject to comparison: A1 and P1, A2 and P2, etc. The results of such comparisons may or may not correspond to generally established standards. Based on the correspondence or inequality, conclusions are drawn about the liquidity of the book. balance sheet and solvency of the enterprise. The standard recognizes:
- A1>P1;
- A2>P2;
- A3>P3;
- A4 < or = P4.
The ideal result of such comparisons is considered to be when, in fact, a correspondence is established for all four comparisons. Then we can talk about absolute liquidity.
As for the most liquid assets of the balance sheet (A1), they are always compared with the most urgent liabilities (P1). If it turns out that A1>P1, then this will mean that the company is able to pay off urgent debts in the shortest and medium term with the help of highly liquid assets.
| Business valuation | Financial analysis according to IFRS | Financial analysis according to RAS |
| Calculation of NPV, IRR in Excel | Valuation of stocks and bonds |
Liquidity levels
The degree of liquidity of a company's assets is the speed at which they are converted into money. The period required for this transformation is usually counted in days. The shorter it is, the more liquid this or that asset is.
The balance sheet of the Russian Federation is built on the principle of liquidity growth. It lists first the assets whose liquidity is the lowest, and then this degree gradually increases.
Asset liquidity groups
Based on the speed at which assets are converted into financial assets, assets are divided into several groups.
Group 1: absolutely liquid (highly liquid) assets
This is the group of assets that does not need transformation, since it itself represents the financial assets available in the company:
- at the register;
- on current bank accounts;
- on short-term deposits, etc.
This group also includes financial investments that were made for a short period of time.
The defining factor for this group of assets is that they can be used to satisfy financial obligations almost immediately. They are usually designated by the index A1.
Group 2: quickly realizable assets
This includes funds that can be quickly, but not instantly, converted into cash. For quickly realized assets, transformation into money is not a problem, it just takes some time. These include:
- current assets;
- accounts receivable for this year, that is, the period for which expires no later than 12 months after the reporting day.
Quickly realizable assets are designated A2.
Group 3: slowly selling assets
This group of assets turns into cash the slowest, although without relative obstacles, but over a longer period of time. These assets include:
- stocks;
- receivables with a payment term of more than one year;
- VAT on purchased assets;
- long-term financial investments (except for shares in the authorized capital of other organizations).
This group of assets is assigned the A3 index.
Group 4: hard-to-sell assets
This includes funds that are most difficult to transform into cash. Initially, these assets were intended for long-term business activities. On the balance sheet they are reflected in section 1 “Non-current assets”, they are designated as A4.
ATTENTION! Assets of groups A1, A2 and A3, even during the same reporting period, can change with each other in content, forming current assets that are more liquid than all others
Degrees of urgency of liabilities
To analyze the liquidity of an enterprise, it will be necessary to compare assets with liabilities, which means that liabilities must be distributed according to the degree of urgency. This comparison will characterize the possibility of repaying obligations using the assets being sold.
Group 1: liabilities of the greatest urgency
Those obligations that must be repaid as soon as possible, namely:
- loan settlements;
- dividend payment;
- overdue loans;
- other short-term financial arrangements.
Such liabilities, by analogy with absolutely liquid assets, are designated by the P1 index.
Group 2: short-term liabilities
These are expenses that must be incurred within a certain, not too long period (no more than a year from the reporting date):
- short-term loans;
- funds borrowed.
This group is assigned the index P2.
IMPORTANT INFORMATION! For groups P1 and P2, it is necessary to know exactly for what specific time certain financial obligations are calculated. This is impossible with external analysis (you have to rely on data from previous periods, which reduces accuracy), but is quite feasible with internal liquidity research.
Group 3: long-term liabilities
This includes liabilities with the same designation on the balance sheet:
- long-term loans;
- other liabilities with long maturities.
This group is designated P3.
Group 4: permanent liabilities
This includes those liabilities that are included in section 3 “Capital and Reserves” in the balance sheet, as well as some items in section 4 that were not included in deferred income and future reserves.
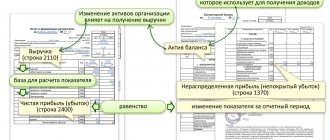
The most liquid assets (A1) according to accounting. balance sheet: composition, lines, calculation formula
In the bay. the balance sheet shows the assets presented as liquidity increases. The balance sheet itself does not indicate the degree of their liquidity (saleability). Therefore, we should proceed from what is included in the most liquid assets (A1) and which balance sheet lines correspond to them. In this regard, the following scheme for the composition of the most liquid assets of an enterprise (A1) will be relevant.
Deciphering “balance sheet” lines using a flowchart. Page 1250 is, literally, “Cash and cash equivalents”, page 1240 is “Financial investments” (meaning short-term). As for page 1250, in the second case, when we are talking about short-term financial investments, this line means only those investments that are classified as cash equivalents.
Thus, the most liquid assets are found in Section II (“Current Assets”). These are cash and cash equivalents, as well as financial investments (except for cash equivalents). Accordingly, A1 is the sum of cash and short-term investments. It follows that the formula for calculating A1 on the balance sheet will be as follows:
This is a standard formula used in the general case for A1 calculation. Below we will also consider typical general situations associated with A1. It should be noted that circumstances are different, sometimes even exceptional. Therefore, in practice, deviations from the general rules and norms are possible. In this regard, the following situation can be cited as a clear example.
Let's assume that an organization bought out receivables on favorable terms. The debtor (legal entity, organization) is obliged to pay it in 9.5 months, so it can be classified as a short-term financial investment. However, six months later the debtor went bankrupt. It is not known when the organization will receive the money now. Accordingly, these assets (according to the balance sheet - page 1240) can no longer be classified as the most liquid, since at this moment they have lost their once high liquidity.
Based on this example, we can conclude that A1 should include those money and short-term investments that are not encumbered with anything. They can also safely include demand deposits, short-term bonds (shares), which are admitted to trading and are included in the highest levels of copying lists.
Liquidity
Liquid funds are easily realizable assets that can be exchanged for cash with maximum speed. It follows that money has the greatest liquidity.
Highly liquid ones include:
- Cash in a bank account;
- At the cash desk of the enterprise;
- Short-term financial investments. They are represented, for example, by securities (shares) that are highly quoted on the stock exchange at a given time.
Attention: The totality of cash and financial investments lasting up to 12 months represent, according to economists, easily realizable assets of the company. According to the degree of liquidity of current assets, they occupy the main place
Comparing short-term accounts receivable with inventories and other current assets, the former will be more liquid.
Also, a sign of easy sale is the presence of a market where this species is freely traded. From the above it follows that it is least profitable, from a financial point of view, to accumulate funds in the “reserves” item. This group includes materials, raw materials, costs of work in progress.
Analysis of the financial stability of an enterprise using highly liquid assets A1
Highly liquid assets (A1), together with other groups of assets and liabilities, are involved in the calculation of several liquidity ratios. All this is done in order to analyze the financial stability of the enterprise, determine its liquidity and solvency.
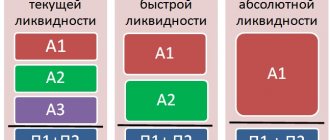
As an example, we further propose to consider the procedure for calculating the main liquidity indicators of an enterprise. They are: the coefficient of urgent (KSL), current (KTL) and absolute (KAL) liquidity. In all cases, calculation is made on the basis of values taken from the accounting records. balance.
KTL is calculated in order to find out the ability of the enterprise to pay off current short-term obligations using exclusively current assets (see section II of the balance sheet). The optimal calculation result is considered to be KTL = 1.5 (maximum 2.5). A KTL value less than 1 signals a destabilization of the financial situation at the enterprise.
Calculation of CFL is needed in order to find out the financial capabilities of an enterprise in difficult situations. In particular, to determine whether it is able, with the help of A1 and A2, to pay off current obligations if difficulties arise with the sale of products, etc. The value of 0.7 is recognized as the normative value for KSL. This is a kind of minimum acceptable starting point. The best result is considered when KSL = 0.8 (up to 1.2).
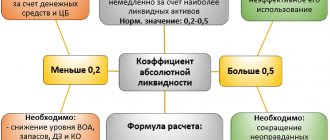
KAL calculates in order to determine what share (part) of short-term debt the company will be able to repay in the near future. The standard value for KAL is 0.2. It indicates that the company is able to cover 20% of its urgent obligations every day. If CAL turns out to be lower (less than 0.2), then the financial situation can be called critical. This means that the company has low solvency and cannot pay its debts on time.
All of the above calculations use highly liquid assets, as evidenced by the presence of A1 in the formulas. To summarize, attention should also be focused on the fact that if highly liquid assets exceed all of the company’s liabilities, then this indicates its absolute financial solvency and stability.
Liquidity ratios and methods of their calculation
The key to competent and effective management of an enterprise, as well as personal capital, is the analysis of liquidity ratios. These ratios are used both by buyers to evaluate a company when selling it, and by investors before making any investment.
There are 3 main ratios, the so-called “golden three” indicators that can accurately assess the degree of liquidity of a particular asset of an enterprise.
| Liquidity ratio | Description |
| Absolute | This indicator helps determine how quickly a company can pay off all its obligations using only its most highly liquid assets. Calculated as the ratio of highly liquid assets (cash and short-term financial investments) to current liabilities |
| Fast | Using this ratio, you can understand whether the company will be able to pay off its debts, even if difficulties arise with the sale of finished products. It is used to assess the quick solvency of an enterprise. Calculated as the ratio of highly liquid assets plus short-term receivables and current liabilities |
| Current | Using this indicator, you can determine whether the company can pay off all short-term obligations using only current assets. Used by investors to assess the attractiveness of investments and represents the ratio of current assets to current liabilities |
Example 1. Calculation of A1 amount as of December 31, 2018
Data for calculation are taken from accounting records. balance sheet of Tekhstroy LLC. A1 was calculated using the “balance sheet” formula (p. 1240 + p. 1250). The calculation results along with the indicators are shown in the table.
| Indicator and line name | Data on it as of December 21, 2018. (million Russian rubles) | Costing A1 |
| Page 1240. Cash and cash equivalents | 45 900 | |
| Page 1250. Short-term financial investments, as well as: | 35 700 | A1 (line 1240 + line 1250) = 45,900 + 35,700 = 81,600 |
| bank deposits | 30 000 | |
| loans issued | 5 700 |
It should be noted that when calculating A1, the total amount on line 1250 was used, which includes bank deposits and loans. That is, short-term investments (p. 1250) here are deposits + loans (30,000 + 5,700 = 35,700).
The resulting value of A1 (81,600) should be used when comparing A1 with P1, as well as when calculating liquidity indicators (KAL, KTL, KSL ratios).
Long-term liabilities (P3)
Liquidity refers to the ability of an asset to be converted into cash. If we approach it from this position, then all assets, with rare exceptions, can be called liquid to one degree or another, because with varying degrees of complexity they can be sold and converted into cash.
However, in practice, liquid assets are usually called those assets of an organization that are converted into cash equivalent with the least expenditure. The best option is when you can sell it instantly or literally in a few days. According to some sources, a characteristic feature is the presence of a specialized market where these types of assets rotate - for example, the market for currencies, precious metals, and securities.
https://www.youtube.com/watch?v=ytaboutru
All other types of investments are classified according to the degree of liquidity into categories A1, A2, A3, A4. The easiest way to consider these categories is to systematically move through sections I and II of the balance sheet, where they are arranged in order of increasing liquidity.
A4 – illiquid assets
But there are two factors at play here. Firstly, the implementation process can take several months. Secondly, a lot depends on the demand for the property being sold and whether there is a buyer for it. Therefore, although these objects can theoretically be sold and converted into cash, they are still considered illiquid (in fact, they are simply the least liquid).
A3 – slowly selling assets
Page 1200 – page 1250 – page 1240 – page 1230.
A2 – quickly realizable assets
This includes accounts receivable (line 1230, i.e. those for which payments will be received in the next 12 months; the longer-term debt relates to A3), as well as other current assets from line 1260, if any.
Accounts receivable do not depend in any way on demand or the availability of buyers, as was the case with low-liquid assets. In fact, these debts are already in cash form; you just need to collect them from the debtors.
A1 – the most liquid assets
Here the money in all accounts and short-term financial investments (SFI) are summed up. These are lines 1240 and 1250 of the balance sheet. This category of assets is either already in cash or can be converted into cash almost instantly and used to pay off the company's liabilities.
For example, transactions for the sale of shares, other securities, investments in precious metals and other liquid goods can be carried out within one business day.
With banking organizations, the main feature is that the lion's share of their assets is financial. Yes, there are also fixed assets and intangible assets in the form of buildings, computers, programs and other things, but the main turnover comes down to loans, deposits, money in accounts and other banking products.
The classification by liquidity level here is similar to that applied to enterprises:
- self-liquidating (direct cash);
- highly liquid (sold within a few days);
- medium-liquid (sold within a few weeks);
- low-liquidity (sold within a few months).
However, it should be noted that the category of problem assets is also present in enterprises - this will include, for example, property that is under arrest or pledged, or the ownership of which is being disputed in court, as well as all doubtful debts that debtors are no longer likely to will they return it?
A1 – P1
Reflects the ratio of current payments and receipts. The recommended value is greater than or equal to 0.
A2 – P2
A3 – P3
Shows the trend of increasing or decreasing current liquidity in the near future. The recommended value is greater than or equal to 0.
A4 – P4
This means that equity must be sufficient to cover the need for non-current assets. The recommended value is greater than or equal to 0.
Financial ratios in IT Audit: Auditor
Answers to frequently asked questions
Question #1: What does “cash equivalents” mean? What do they include?
Cash equivalents are monetary documents (financial investments) that are highly liquid, have an exact value, and are reliable when converted into cash or non-cash funds. For example: demand deposits, bills of exchange from a reliable credit institution.
| Business valuation | Financial analysis according to IFRS | Financial analysis according to RAS |
| Calculation of NPV, IRR in Excel | Valuation of stocks and bonds |
Calculation of the value of the most liquid current assets
The bank's assets in the form of cash balance are assigned a risk factor of 2%, which does not exclude a small degree of risk for this operation.
The second group includes assets with a minimum risk ratio of 10%. These are loans guaranteed by the Russian Government; loans secured by precious metals bullion; loans secured by government securities (the most risky operation).
Active operations of banks classified in the fifth group
assets. These are bill of exchange loans, short-term and long-term loans to customers, debtors for business transactions and capital investments of the bank, as well as the bank’s own buildings. Of course, the probability of loss of funds for the assets of this group is different, but in a certain situation they can be maximum.
Contents of active operations of a commercial bank.
1. Loan operations – operations to provide funds to the borrower on the basis of urgency, repayment and payment. As a result of a lending operation, a banking asset arises that generates income in the form of a loan.
2. Settlement operations - refer to active operations in terms of making payments on the bank’s own obligations, as well as on instructions from the bank’s clients to pay their obligations to counterparties.
3. Cash transactions – as active operations, they represent the placement of non-cash money into cash by transferring a certain amount from the bank’s correspondent account to the RCC and receiving bills and small change coins at the RCC cash desk.
4. Investment operations – operations involving the investment of a bank’s own funds into securities and shares of other legal entities for the purpose of joint economic, financial and commercial activities designed to generate profit in the form of dividends, as well as placement of funds in the form of time deposits in other commercial banks.
5. The bank’s stock operations are part of the commercial bank’s active operations with securities, which it carries out on the securities market on behalf and at the expense of its clients, and includes the purchase and sale of securities, lending secured by securities, placement of newly issued securities, investments in securities, storage and management of securities, accounting of bills, etc.
6. Currency transactions - transactions for the purchase of foreign currency for rubles to make payments under international contracts of bank clients, as well as to obtain speculative benefits in case of different exchange rate fluctuations.
7. Guarantee operations are operations where a bank issues guarantees to its client, who can use them as security for the repayment of a loan received from another bank or company. By issuing a guarantee, the bank undertakes to carry out an active operation to pay off the debt of a legal entity upon the occurrence of a guarantee event.
8. Commission transactions - transactions carried out by the bank on behalf of, on behalf of and at the expense of the client’s funds (transfers, purchase and sale of securities on the stock market, guarantee).
9.Leasing - the bank's leasing operations include long-term lease of machinery, equipment, vehicles, and production facilities. Leasing is the acquisition of equipment and its provision for rent to organizations (lessee) in exchange for leasing payments. Leasing provides for the possibility of purchasing equipment upon expiration of the lease agreement or ahead of schedule at its residual value.
10. Factoring is the repurchase of payment requirements from the supplier of goods (services). 11. Forfeiting is a type of factoring.
12. Trust management is a service provided by management companies or banks in the securities market. In trust management, the client transfers funds or other assets to the management company under an agreement. She carries out transactions on her own behalf, but in the interests of the client, for which she receives remuneration in the form of a part of the earned profit or as a percentage of the value of assets under management.
Date added: 2015-05-21; ;
Liquidity and financial stability analysis: what and why
Author’s version of the article by Irina Koltsova “Standards for liquidity, financial stability and independence for yours No. 4, 2011
Many people associate financial analysis with the tedious calculation of many ratios that poorly reflect the real processes occurring in the company. Indeed, if you consider 30–40 indicators from period to period with conclusions: “The current liquidity ratio decreased by 18% from 1.7 to 1.4 during the analyzed period, which corresponds to a drop of 0.3 points,” etc. , then there is no point in financial analysis.
Let’s try to understand, using the example of liquidity and financial stability indicators, why these indicators need to be calculated, and how to take a “non-standard” approach to understanding and using them.
Liquidity (current solvency) is the ability to pay obligations in full and on time. The most common indicators are net working capital (NWC) and current ratio (CR).
Net working capital, NWK - the difference between current assets and short-term liabilities.
NOL = Current assets - Current liabilities
It is necessary to maintain the financial stability of the company. A positive NER value serves as an indicator of the company's solvency for investors and creditors, and also indicates the possibility of expanding its activities in the future using internal reserves. A negative net working capital indicates an inability to repay all short-term obligations on a timely basis, because All current assets and part of non-current assets were financed through borrowed capital.
The optimal value of NSC depends on the industry, the scale of the enterprise, sales volume, turnover of fixed assets, and the economic situation in the country.
To determine the amount of NSC, the minimum required for a particular company, we follow the financial rule: the least liquid assets must be financed from our own funds. According to the generally accepted gradation in financial management, these include inventories of raw materials and work in progress. Hence:
Sufficient NER = Raw materials inventories + Work in progress
Comparing the actual value with a sufficient value will allow us to draw a conclusion about the sufficiency or insufficiency of own funds allocated to finance working capital.
Taking into account the individuality of the enterprise, we can proceed from the definition of “own” liquidity of assets. For example, in the food industry, products (flour, sugar, yeast, etc.) serve as raw materials; we will not call them illiquid assets, and, therefore, it is not necessary to “reserve” your own funds for them. And vice versa, if you look at the balance sheet of an aircraft manufacturing company (or any other company with a long production cycle), then a huge share of current assets will be occupied by the “Work in Progress” position, which will be 100% illiquid, and it is in the interests of the company to provide this asset with its own funds or long-term liabilities. In the event of a crisis, seemingly liquid “finished product inventories” for the metallurgical industry will be difficult to quickly sell at a normal price, and, therefore, they may receive the status of “least liquid current assets,” etc.
In some cases, it makes sense to determine the level of liquidity based on an understanding of the composition of the asset, the location of the enterprise, market conditions and other factors affecting the attractiveness and cost of current and fixed assets.
With the development of the company, the structure of the balance sheet may change, which imposes an obligation to periodically calculate the actual and sufficient value of NSC and compare them with each other.
A significant excess of net working capital over the optimal need for it indicates inefficient use of resources. Examples are: additional issue of shares or attraction of loans in excess of real needs for operating and investment activities, accumulation of funds due to the sale of fixed assets, irrational use of profits from core activities.
Often at enterprises the problem is exactly the opposite - negative NER or its insufficient value.
Negative PSC can be caused by:
- losses from core activities;
- investment costs exceeding one’s own financial capabilities (purchase of expensive fixed assets without prior accumulation of funds for these purposes);
- financing of investments through short-term loans;
- growth of bad accounts receivable;
- payment of dividends in the absence of corresponding profits;
- financial unpreparedness to repay long-term loans.
Let's look at the calculation of the actual and sufficient NER value using an example.
Tab. 1 : NER calculation
| 2008 | 2009 | 2010 | |
| ASSETS | |||
| Total non-current assets | 27000 | 44000 | 47000 |
| Stocks of raw materials and supplies | 3800 | 4300 | 4500 |
| Inventory in work in progress | 500 | 600 | 650 |
| Inventory in finished goods | 1200 | 1500 | 1650 |
| Accounts receivable | 5500 | 5800 | 6200 |
| Cash | 150 | 200 | 50 |
| Other current assets | 2300 | 1800 | 1850 |
| Total current assets | 13450 | 14200 | 14900 |
| PASSIVE | |||
| Total equity | 23400 | 26800 | 29800 |
| Total long-term liabilities | 9250 | 18200 | 17300 |
| Total current liabilities | 7800 | 13200 | 14800 |
| Actual net working capital | 5650 | 1000 | 100 |
| Increase in non-current assets | 0 | 17000 | 3000 |
| Increase in current assets | 0 | 750 | 700 |
| Increase in equity capital | 0 | 3400 | 3000 |
| Increase in long-term liabilities | 0 | 8950 | -900 |
| Increase in short-term liabilities | 0 | 5400 | 1600 |
| Increase in NER | 0 | -4650 | -900 |
| The cost of the least liquid part of current assets (inventories of raw materials and work in progress) | 4300 | 4900 | 5150 |
| Sufficient NER value | 4300 | 4900 | 5150 |
The decrease in net working capital in 2009 was associated with a large acquisition of non-current assets exceeding the increase in equity capital (due to earned profits reinvested in production) and attracted long-term loans; in 2010, the decrease was due to the repayment of a long-term loan, which affected the decrease in the solvency of the enterprise.
Let's analyze the situation taking into account the sufficiency/inadequacy of the NER value. In 2008, due to the excess of the actual value over the sufficient value, a “reserve for the level of equity capital” was observed. The “reserve” represented the possibility of accelerated growth of borrowed capital, which the company could allow without loss of financial stability and solvency. In our example, an increase in short-term liabilities within the range of 1350 (5650–4300) will not lead to a decrease in the company’s solvency. However, in subsequent years, the company exhausted this “reserve” and even exceeded the permissible NER value, which led to a decrease in financial stability due to the threatening growth of borrowed capital.
To increase net working capital and ensure a sufficient amount of PSC, it is necessary:
- Ensure the growth of profits reinvested in production;
- Finance the investment program with long-term loans (short-term loans should finance the increase in current assets!)
- Make investments within the limits of the profit received, attracted long-term loans, taking into account the value of the NER of the previous period (does the actual NER exceed its sufficient value - is there a “reserve”)
- Optimize the amount of inventory, work in progress, i.e. least liquid current assets.
To assess the short-term solvency of companies, the current liquidity ratio is widely used, defined as the ratio of current assets to the company's short-term liabilities.
In international practice, it ranges from 1 to 2, depending on the industry, and differs in different countries.
Tab. 2 Current ratio in international practice
| Industry | A country | |||
| USA | England | Japan | Europe | |
| Light industry | 2.5 | 1.8 | 1.8 | 1.8 |
| Food industry | 1.25 | 1.25 | 1.35 | 1.45 |
| Mechanical engineering | 1.1 | 1.1 | 1.2 | 1.5 |
| Trade | 1.6 | 1.3 | 1.1 | 1.0 |
| Average | 1.25 | 1.25 | 1.25 | 1.25 |
In Russia, the standard for this indicator is considered to be 2 (according to the methodology of the FSFO of the Russian Federation) or they refer to statistics on coefficients in industry directories.
In my opinion, comparison with statistical data is difficult both in the context of understanding how these statistics are formed, and taking into account the approach to comparison itself (by analogy with the average temperature in a hospital).
Therefore: 1) if you compare indicators, then based on your own calculations of similar indicators of competing companies or industry leaders. In this case, the calculation algorithm, the source of data and the purpose of the analysis are clear (for example, the desire to achieve the indicators of leaders). It is quite easy to find OJSC reports on websites; 2) collect statistics and pay attention to the dynamics of your odds.
The next task is to determine the acceptable value of the indicator for this particular company. To calculate the acceptable value of the current liquidity ratio, we will use the already announced rule of financial management: the least liquid current assets must be financed from our own funds.
Let's consider the algorithm for calculating a sufficient level of the current liquidity ratio:
1. Let's determine the least liquid part of current assets: inventories of raw materials and work in progress. This value corresponds to a sufficient amount of net working capital.
2. Let's calculate the permissible amount of short-term liabilities, guided by the following logic: we finance the least liquid current assets with our own funds, which means that liquid current assets can and should be financed with short-term liabilities.
3. Let us determine the sufficient current liquidity ratio:
Sufficient values of the current liquidity ratio must be compared with its actual values, on the basis of which a conclusion can be drawn about the sufficiency or insufficiency of the level of overall liquidity of the enterprise.
Tab. 3 calculation of current ratio
| 2008 | 2009 | 2010 | |
| The cost of the least liquid part of current assets (sufficient amount of NOC) | 4300 | 4900 | 5150 |
| Permissible amount of short-term liabilities | 9150 | 9300 | 9750 |
| Sufficient level of current ratio | 1,47 | 1,53 | 1,53 |
| Actual current ratio | 1,72 | 1,08 | 1,01 |
In none of the periods was the liquidity ratio lower than 2 for all three years. However, in 2008, the actual liquidity ratio exceeded the sufficient level of the company, which corresponds to the presence of a “reserve” in the amount of NWO and indicates an acceptable level of financial stability and solvency of the company. In subsequent periods, there is a noticeable decrease in the total liquidity ratio - from 1.72 to 1.01 and even going beyond the optimal level for a given company, which is a signal of a decrease in liquidity and the emergence of a critical situation. Such a decrease in the current liquidity ratio should attract attention and be noted, but the company’s position even in this situation can be considered acceptable, taking into account the positive value of NER and the reasons that caused the decrease in the indicator.
The reasons for the decrease in the current liquidity ratio echo the reasons for the decrease in the NER value, because the nature of these indicators is the same, namely:
- losses, and, as a consequence, a decrease in equity capital, i.e. an increase in the indicator comes down to an increase in the profitability of the activity and an increase in the share of profits remaining at the disposal of the enterprise (this is the case if the company earns enough, but prefers to pay dividends or withdraw funds to other companies rather than reinvesting them in the business);
- capital investments (purchase of fixed assets, construction of new production facilities, large-scale technical re-equipment, etc.) exceeding the amount of earned profit and attracted long-term loans will require the attraction of additional borrowed funds. To improve the liquidity ratio in this context, it is necessary to control the growth of borrowed funds, especially short-term loans;
- financing investments with “short-term” money (short-term loans) is the most common reason!!! When attracting short-term loans, the company must repay them in the short term. If short-term loans finance the need for working capital, this is usually associated with an increase in sales volumes, which provides additional profit, a source of debt repayment. Receiving additional profit through investments lasts for years (taking into account the payback period of investments), which means that in the short term the source of repayment of short-term obligations will not be enough, which imposes additional difficulties on the company in ensuring current solvency and refinancing.
A one-time calculated sufficient level of the current liquidity ratio is not a once and for all fixed benchmark for the company. He is authorized for a specific period characterized by certain working conditions. When the parameters of the company's activities change (the size of assets, profitability of activities, etc.), the sufficient level of liquidity ratios will also change. In this regard, it is advisable to calculate the total liquidity indicator acceptable for a given company for each analysis interval.
Gradually, the organization will be able to accumulate a statistical database of acceptable (optimal) values of the current liquidity ratio depending on operating conditions.
Continuing the topic of ensuring the financial stability of the company, it is necessary to understand how financially independent the company is from creditors, and what is its ability to repay not only current but also long-term obligations.
Financial independence/total solvency ratio (Equity to Total Assets)
The main guideline is ≥ 0.5, which corresponds to the understanding of the balance sheet structure as: the company’s equity capital must be at least 50%; in the case of a one-time presentation of bills to creditors for payment, the company, having sold assets, will pay off its liabilities.
But equity capital is invested in assets with varying degrees of liquidity, which means that the company’s ability to meet its obligations depends on the degree of liquidity of the assets. Consequently, here too it is necessary to take a “non-standard” approach to calculating the acceptable ratio of equity and debt capital, depending on the structure of assets.
The algorithm for calculating a sufficient value of the financial independence ratio is similar to calculating a sufficient liquidity ratio, only taking into account all the assets of the enterprise:
1. The level of financial stability in the long term is achieved if the condition is met: the least liquid assets must be financed from own funds, namely non-current assets + the least liquid current assets (inventories of raw materials and work in progress)
Equity capital required to ensure financial stability = least liquid assets that must be financed from own funds = Non-current assets + Inventories + Work in progress
2. A sufficient financial independence ratio is defined as the ratio of the required amount of equity capital to the actual value of the company's assets (balance sheet currency).
The calculated sufficient values of the financial independence ratio must be compared with the actual values, which will allow us to draw a conclusion about the sufficiency or insufficiency of the company’s level of financial stability. It is worth noting that it is interesting to control the difference between the actual and sufficient level of coefficients. If the actual value of the coefficients decreased, but the difference between the sufficient and actual values remained the same, the level of financial stability can be considered preserved.
Let's consider the calculation of the actual and sufficient financial independence ratio using an example.
Tab. 4: calculation of the financial independence ratio
| 2008 | 2009 | 2010 | |
| ASSETS | |||
| Total non-current assets | 27000 | 44000 | 47000 |
| Stocks of raw materials and supplies | 3800 | 4300 | 4500 |
| Inventory in work in progress | 500 | 600 | 650 |
| Inventory in finished goods | 1200 | 1500 | 1650 |
| Accounts receivable | 5500 | 5800 | 6200 |
| Cash | 150 | 200 | 50 |
| Other current assets | 2300 | 1800 | 1850 |
| Total current assets | 13450 | 14200 | 14900 |
| PASSIVE | |||
| Total equity | 23400 | 26800 | 29800 |
| Total long-term liabilities | 9250 | 18200 | 17300 |
| Total current liabilities | 7800 | 13200 | 14800 |
| Total balance currency | 40450 | 58200 | 61900 |
| Required amount of own funds (Non-current assets + least liquid current assets) | 31300 | 48900 | 52150 |
| Sufficient financial independence ratio | 0,77 | 0,84 | 0,84 |
| Actual financial independence ratio | 0,58 | 0,46 | 0,48 |
Calculation of the financial independence indicator showed that, as a rough approximation, in all three periods the financial independence coefficient corresponded to the standard of ≈ 0.5. However, the calculation of the required amount of equity, reflecting the least liquid assets, showed that the requirement for this ratio should be higher. At the level of 0.77–0.84, and in none of the analyzed periods the company achieved an indicator sufficient for it, which indicates the instability of its financial position and the potential loss of financial independence.
To find out ways to optimize the current situation, it is necessary to analyze the reasons for the decrease in the indicator of financial independence:
- losses, and, as a result, a reduction in equity capital;
- growth of assets (investments, working capital) exceeding the volume of profit received, which entails the attraction of additional borrowed capital.
In the example under consideration, a profit is earned, but it is not enough to finance the large-scale increase in non-current assets and the growing need for working capital. Analyzing the increase in non-current assets for the period under review by almost 2 times, the conclusion suggests itself that the company is making large investments comparable in scale to its existing activities. Most likely, the investment phase will end in the near future, new capacities will be put into operation, which will generate additional profits, which will be a source of repayment of long-term loans. Gradually, the loan will be repaid, the share of borrowed capital will decrease, and the indicator of financial independence will be restored to an acceptable value for this company. The main recommendation for reducing the debt burden in this example is to quickly reach the additional amount of profit planned for the new capacities.
The purpose of financial analysis is not just to calculate ratios, but to obtain information necessary for making management decisions! This means the task is to be able to obtain and use this information for operational and strategic planning of the company’s activities .
Cash as the most liquid component of current assets
Debit turnover on current accounts, cash balances, transfers in transit - all this refers to the most active funds of organizations. They have almost 100% liquidity, since their involvement in turnover will require a minimum of time. It is also believed that their value lies precisely in the ability to quickly carry out specific economic actions. In the life of business entities, these are understood as transactions, sales, acquisitions and other ways of meeting the current needs of existing enterprises. Thus, shares and other securities can be quickly sold on the stock exchange according to the current exchange rate of the financial instrument with minimal losses. Organizations often engage in investing – financial activities. These are loans to other organizations and other investments, for example, shared construction.
But the least liquid current assets are accounts receivable, including short-term ones. The value of payments for goods or services provided is higher than inventory. The assessment of the degree of transformability will again have to be done by the company’s financiers in order to assign it to one or another group of assets.
Tags: asset, balance sheet, accountant, currency, capital, ratio, credit, least liquid current assets, tax, problems, expense
The degree of liquidity of organizations' assets
The transformation period as a leading indicator of the attribution of assets belonging to an enterprise makes it possible to subdivide assets according to the level of liquidity:
- The assets are absolutely liquid. Values that, as such, do not require implementation to participate in the economic activities of the company. These are ready-made means of making payments;
- Assets with a high degree of liquidity - funds with a monthly readiness period;
- Working capital in terms of liquidity is “average” - can be sold within six months;
- Enterprise funds that have potential with a short-term horizon of more than six months are classified as low-liquid.
Among the property of an enterprise there are always assets that are considered illiquid. It is not possible to implement them in their pure form. Therefore, the insertion of such property for sale is usually carried out as part of an industrial complex.
In order to arrange current assets in order of decreasing liquidity, specific assessment indicators are used in international practice. Ratios are calculated for current and quick types of liquidity. A normal value is two or higher (for current liquidity) and at least one for a quick indicator.
The assessment results for different industrial and service sectors are different. When analyzing financial and economic activities, enterprises usually rely on statistical data.