What does return on assets show?
Profitability is a whole system of indicators that characterize the efficiency of an enterprise. One such indicator is the return on assets ratio. It is usually denoted by ROA (short for return on assets).
This coefficient demonstrates how high the return on funds invested in the organization’s property is, what profit each ruble invested in its assets brings to the company.
In general, the formula for calculating return on assets can be presented as follows:
ROA = Pr / Ak × 100%,
Where:
ROA - return on assets;
Pr - profit (for calculation, either net profit or profit from sales is taken, depending on what profitability the user is interested in);
Ak - assets of the organization (as a rule, the average value of assets for the period is used for calculation).
Return on assets is a relative indicator, usually expressed as a percentage.
Return on equity ratio (ROE)
Foreign abbreviation ROE - Return on shareholders' equity. This indicator characterizes how much net profit falls on the enterprise’s capital, which includes both its own and borrowed capital. The return on equity ratio allows you to compare different investment options according to the degree of profitability, for example, investments in the authorized capital of an enterprise, investments in deposits, shares, bonds, real estate, etc. The formula for calculating the return on equity ratio is as follows:
Return on equity ratio (ROE) = Net profit / Average equity capital ROE = line 190 Form No. 2 / (0.5*(line 490 at the beginning of the year + line 490 at the end of the year))
How to calculate the profitability of non-current assets (balance sheet formula)
Non-current assets are the so-called long-term assets that the company uses for a long time - more than 12 months. Such property is reflected in section I of the balance sheet. These are fixed assets, intangible assets, long-term financial investments, etc.
When calculating the profitability of assets of this category, the denominator needs to reflect the total for section I - line 1100. Then we will get the profitability of all existing non-current assets.
If necessary, you can analyze the profitability of a particular type of asset, for example, fixed assets or a group of non-current assets (tangible, intangible, financial). In this case, the data on the lines that reflect the corresponding property is substituted into the formula.
The easiest way to calculate the average value of assets is to add the indicators at the beginning and end of the year and divide the sum by 2.
For more information about the balance sheet, see “Filling out Form 1 of the balance sheet (sample)” .
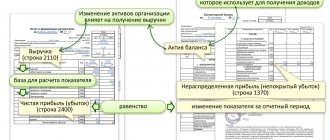
The profit indicators for the numerator of the return on assets formula must be taken from the financial results statement, known to everyone as Form 2:
- profit from sales - from line 2200;
- net profit - from line 2400.
About Form 2, read: “Filling out Form 2 of the balance sheet (sample)” .
What constitutes non-current assets of an enterprise?
Non-current assets of an enterprise are means of production used in its activities for a long time (more than a year). They are distinguished by:
- direct connection between the composition and the direction of activity;
- repeated use during work;
- gradual transfer of value to costs;
- inertia towards change;
- difficulty in liquidation.
The presence, composition, condition, nature of ownership of non-current assets characterize the property status of the legal entity, the level of organization and the sustainability of its business. And competent management of these assets leads to an increase in the profitability of the enterprise.
The basis of non-current assets is fixed assets and intangible assets, and fixed assets are of decisive importance among them due to the need for large volumes and because of their higher cost. Therefore, the analysis of non-current assets, without which it becomes impossible to manage them, is primarily an analysis of the state of the operating system.
Why does an accountant need return on assets?
It is generally accepted that, for the most part, the return on assets indicator is of interest to financiers and analysts who assess business performance and look for growth reserves. However, it is also important for accountants or tax specialists of companies. The fact is that profitability, including return on assets, is one of the criteria for assessing the risk of falling into the tax audit plan provided for by Order of the Federal Tax Service of Russia dated May 30, 2007 No. MM-3-06/ [email protected] A critical deviation is considered to be a deviation in profitability the organization's assets from the industry average by 10% or more.
Return on assets in the main areas of activity since 2006 is given in Appendix 4 to the order of the Federal Tax Service of Russia dated May 30, 2007 No. MM-3-06/ [email protected] Calculate your return on assets and compare it with the industry average. What if you are already under control? You can view the industry average profitability (download Appendix 4 to the order of the Federal Tax Service of Russia dated May 30, 2007 No. MM-3-06 / [email protected] ) on the tax service website.
Goals of analysis of non-current assets of an enterprise
The specific goals of the analysis of non-current assets are determined by the tasks assigned to it by management decision makers, and to a large extent depend on the specifics of doing business. Usually the analysis is multifaceted, allowing to evaluate:
- current structure and condition of assets;
- the existing level of efficiency of their use;
- the dynamics of changes taking place;
- trends of change in predicted conditions.
The result of the analysis should be the selection of the optimal model for the use of non-current assets that meets the existing management task.
During the analysis process, the following is assessed:
- provision of non-current assets with equity capital;
- the impact of changes in the value of non-current assets on the structure of the balance sheet;
- indicators of the current state of the OS (level of wear and efficiency of use);
- the nature of changes over time in the main indicators characterizing the use of non-current assets;
- dynamics of costs for maintaining the OS in proper working condition and how they are reflected in the cost of production;
- the impact of capital investments on the structure of non-current assets and business efficiency;
- the reasonableness of attracting borrowed funds for capital investments.
Both absolute and relative values are used as calculated indicators, providing information both for the current assessment and for forecasting the dynamics of changes with the identification of the main reasons on which they depend.
The analysis is carried out with the required depth of detail of non-current assets in the following sequence:
- Collection of data, systematization in tables.
- Calculation of characteristic indicators, identification of trends.
- Determination of optimal indicators for further work.
Results
Calculation of profitability is necessary both for assessing the effectiveness of investments and for planning interaction with tax authorities. If profitability indicators deviate from the industry average by 10% or more downwards, this means that the organization is at risk and can be included in the on-site tax audit plan.
Read about the calculation of other profitability indicators in the following articles:
- “The procedure for calculating the profitability of an enterprise (formula)”;
- “How to calculate product profitability?”;
- “Determining return on equity (formula).”
You can find more complete information on the topic in ConsultantPlus. Free trial access to the system for 2 days.
Why does the profitability of current assets rise and fall?
Growth in the profitability of non-current assets
To determine whether this indicator is growing or falling in dynamics, you need to regularly carry out calculations and compare them with each other.
If the value increases, this indicates that the company is using production assets more efficiently, while a regular decrease indicates that the company’s costs are growing and production assets are being used incorrectly.
However, under certain circumstances, a fall may be justified. For example, when an enterprise launches production of new products or switches to new technology. To set up all processes at the initial stage, investments are required, which are recouped gradually.
Reasons for the increase in profitability of non-current assets:
- Increase in sales;
- Improved equipment use.
- Reasons for the decrease in non-current assets:
- Decrease in sales volumes;
- Deterioration in the efficiency of equipment use;
- Transition to the production of a new product or new technology.
How are adjusted non-current assets calculated?
Let us assume that the financial statements contain the following data as of the reporting date of the end of the year:
Intangible assets (p. 1110) – 55,000 rubles, OS (p. 1150) – 930,000 rubles;
- profitable investments in MC (p. 1160) – 42,000 rubles;
- Finnish investments (p. 1170) – 88,000 rubles;
- other VNA (equipment requiring installation, p. 1190) – 110,000 rubles.
In addition, from the explanations of the income statement it is known that:
- business reputation of the company - 31,000 rubles;
- costs for leased operating systems – 15,000 rubles;
- unfinished capital investments – 77,500 rubles;
- similar unfinished investments for the lease of fixed assets - 5,200 rubles.
Calculation of SVNA indicators:
- NMA. 55,000 – 31,000 = 24,000 rubles;
- OS. 930000 – 15000 = 78000 rub.;
- Unfinished capital investments. 77500 – 5200 = 72300 rub.;
- Profitable investments in MC, completely. 42,000 rub.;
- Financial investments are long-term, completely. 88,000 rub.;
- The equipment is the same as other VNA, completely. 110,000 rub.
SVNA = 24000 + 78000 + 72300 + 42000 + 88000 + 110000 = 414300 rub.
When analyzing financial condition, as a rule, indicators are calculated for the previous 3 years, and, if necessary, for a longer period.
On a note. Regulatory documents provide for analysis at least 2 years before the bankruptcy of a business entity. The rules (order 367) recommend the calculation of quarterly indicators of financial and economic condition and for the period of bankruptcy procedures, in dynamics.
The results are presented in the form of tables for ease of perception and subsequent calculations of coefficients characterizing the economy of the research object.
Asset turnover
View this article in PDF
Formula for calculating asset turnover
Asset turnover usually refers to the ratio of sales revenue to the company's total assets (Total assets turnover). The formula for calculating the indicator looks like this:
where: Revenue is sales revenue. In some formulas it is denoted in the same way as Net Sales , in which case it is implied that various discounts, refunds and losses are subtracted from sales revenue. For most financial statements, these formulations will be identical, since many companies show exactly the net result as revenue in their report. Total Assets - total assets. Typically, the average is used between the value at the beginning and end of the reporting period.
There is another version of the indicator - fixed asset turnover ( Fixed Assets Turnover ). Its formula:
where Fixed Assets are the company’s total fixed assets.
The turnover ratio is calculated for the year, therefore, if the revenue in the calculations is taken for a quarter, then the resulting value must be multiplied by 4. In addition, when using quarterly values, you must make sure that seasonal fluctuations do not distort the result.
Asset turnover in financial analysis
Asset turnover measures a company's overall ability to generate revenue using the assets it owns. The version of the TAT indicator analyzes the use of the entire set of assets: fixed assets, inventories, other current and non-current assets. The FAT measure focuses only on buildings, equipment and other fixed assets.
A low turnover value may indicate inefficiency in the business or significant investments made by the company. Obviously, in each industry, and even within individual market segments, the normal level of capital required to support production and sales will vary. Therefore, the turnover analysis will be based on a comparison of the company's performance with its competitors, as well as with its own values for previous periods.
But even in cases where a company's asset turnover is lower than that of competitors, or decreases from year to year, this does not necessarily mean low performance. Here are some reasons why a company's asset turnover may be low during normal business conditions:
- the company has invested heavily in business development, but sales are just beginning to grow, and the effect of the investment is expected in the future;
- the company relied on production automation and reducing the share of personnel costs in production costs;
- The company has chosen a strategy to increase inventory to reduce its purchasing costs and increase its profitability.
Given these opportunities, the analyst must evaluate the company's asset turnover in the context of the overall picture of financial results, taking into account data on the profitability of its activities, investment history, chosen strategy and plans.
An example of calculating asset turnover
Below is an example of calculating asset turnover. The lines directly involved in the calculation are highlighted:
We publish such articles regularly. To receive information about new materials, as well as keep up to date with training programs, you can subscribe to the newsletter. If you need to develop specific skills in investment or financial analysis and planning, check out our seminar programs.
Once again, what are assets?
An asset of a particular organization is property that the firm plans to use for profit. Any asset has its own value on the market; it must belong to someone and, we repeat, guarantee a profit. These are the basic features of assets accepted by accountants and economists.
A financial (economic) asset can be either tangible or intangible. The main difference between them is the shape or lack thereof. However, another classification also includes non-current economic assets. Let's figure out what such non-current assets include.
Methods for calculating profitability
Return on total assets shows how many kopecks of profit each ruble invested in its property (current and non-current funds) brings to the organization, ROA. The return on assets (formula) is calculated from the balance sheet and the financial capital as follows:
Page 2300 OFR “Profit, loss before tax” / line 1600 of the balance sheet × 100%.
Net return on assets is calculated as follows:
Page 2400 OFR “Net profit (uncovered loss)” / line 1600 of the balance sheet × 100%.
Profitability of sources of formation of the organization’s property:
Page 2300 OFR “Profit, loss before tax” / Result of section III of the balance sheet × 100%.
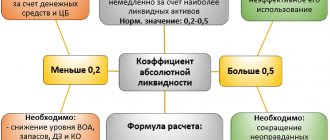
As a characteristic, economic return on assets shows the efficiency of an organization. Normal values of the coefficients should be in the range greater than 0. If the calculated coefficients are equal to 0 or negative, then the company is operating at a loss, and it is necessary to take measures for its financial recovery.
Return on investment, RONA, shows how much profit the company receives for each unit invested in the company's activities. The calculation is made based on two indicators:
- line 2400 OFR “Net profit (uncovered loss)”;
- NA on balance (line 1600 – line 1400 – line 1500).