Analysis of fulfillment of contractual obligations and product sales
Analysis of the fulfillment of contractual obligations in the process of selling products is an integral part of the overall sales analysis.
The analytical activities themselves when researching sales depend on an important point: whether revenue is determined at the enterprise by shipping goods or by paying for them.
Take our proprietary course on choosing stocks on the stock market → training course
Analysis of implementation usually occurs in the following areas-objects:
- Study of the volume of products sold (actual indicators are compared in dynamics and with the plan, factors influencing the sales volume are identified);
- Studying sales in terms of product range and range, identifying and investigating the causes of discrepancies with standards;
- Consideration of product quality indicators: individual, general and indirect (sanctions for low-quality products and defects); study of the influence of quality indicators on cost indicators: output volumes, revenue, profit;
- Studying the structure of products: the preservation of the planned proportions between types of products in the total volume of their output is considered; this is a very important point, since the structure of manufactured (sold) products affects all key economic values of the company: profitability, cost, profit, material intensity, etc.;
- Study of the rhythm of production - that is, the uniformity of product release in accordance with the planned schedule, taking into account the assortment and nomenclature; rhythmicity is the key to meeting deadlines for orders, irregularity is the reason for the deterioration of the organization’s economic performance;
- Shipments and sales are analyzed - actual indicators are compared with planned values and values of previous periods, growth rates are calculated, and appropriate conclusions are drawn.
When studying sales volumes, be sure to also examine the fulfillment of obligations under the contract. The percentage of completion is calculated using the following formula:
Kisp = (OPRpl – OPRn): OPRpl * 100% , where
K – performance coefficient;
OPRpl – planned volume of product sales in accordance with existing agreements and contracts;
OPRn – volume of products not delivered under contractual obligations.
Indicators of fulfillment of obligations under contracts are examined from the beginning of the year on a cumulative basis. They are calculated in terms of individual contracts, delivery times, and types of goods.
Factors of change in product sales volume
The main factors influencing the volume of sales of goods include:
- Fluctuations in product output volumes;
- Fluctuations in the balance of work in progress and intra-economic turnover;
- Changes in the number of remaining unsold goods;
- Change in shipment volumes.
| Business valuation | Financial analysis according to IFRS | Financial analysis according to RAS |
| Calculation of NPV, IRR in Excel | Valuation of stocks and bonds |
Optimal output volume
The optimal production volume is one that ensures the fulfillment of the terms of the concluded agreements within the agreed time frame with minimal costs and maximum efficiency. The optimal volume is determined by comparing gross or maximum indicators.
By comparing gross values, profit is calculated for different volumes of production and sales of products in the following sequence:
• determine the size of the output volume at which profit is equal to 0;
• calculate the volume of production with maximum profit.
Let us demonstrate the calculation of optimal values using an example:
| volume of sales | price | revenue | gross costs | profit (revenue – gross costs) | |
| permanent | variables | ||||
| 0 | 100 | 0 | 1000 | 0 | -1000 |
| 5 | 100 | 500 | 1000 | 200 | -700 |
| 10 | 100 | 1000 | 1000 | 400 | -400 |
| 15 | 100 | 1500 | 1000 | 600 | -100 |
| 20 | 100 | 2000 | 1000 | 800 | 200 |
| 25 | 100 | 2500 | 1000 | 1000 | 500 |
| 30 | 100 | 3000 | 1000 | 1200 | 800 |
| 35 | 100 | 3500 | 1000 | 1400 | 1100 |
| 40 | 100 | 4000 | 1000 | 1600 | 1400 |
| 50 | 100 | 5000 | 1000 | 2000 | 2000 |
The essence of the calculations is to identify the sales indicator with zero and marginal profit. The table shows that the company will be able to achieve zero profit by producing from 15 to 20 parts. The profit will reach its maximum value when producing 50 pieces. In this example (with given cost parameters), a sales volume of 50 units will be the optimal indicator, and when concluding supply contracts, one should proceed from the optimal production size.
By comparing the marginal indicators, it is determined to what point an increase in production volume will be appropriate. Here the economist's attention is drawn to costs and income. There is a rule - if the maximum income per unit of product is higher than the maximum cost, then you can further increase production volumes.
When calculating the optimal values, it is necessary to take into account factors affecting the volume of product sales. These include:
- factors indicating the company’s provision with material and raw materials resources, specialists, the use of new technologies and techniques, etc.;
- factors that depend on market indicators, for example, product prices, market saturation with competitive products, purchasing power, etc.
Options for the sales volume analysis methodology
There are two main options for researching sales volume. They depend on how the organization recognizes revenue.
- The first option involves recognizing revenue from shipment, that is, the number of goods shipped is considered equal to the number of products sold.
- In the second option, revenue is recognized upon payment, that is, not immediately upon shipment, but only after receipt of money from the buyer into the account (by the way, this can happen before the goods are sent to him; in this case, the fact of shipment itself is not taken into account).
How to calculate product sales volume (formula)
Important!
The formula for calculating sales volumes depends on the revenue recognition method established in the organization’s accounting policy. The possible options were discussed in the previous paragraph.
If we are talking about recognizing revenue from shipments, then the balance of products sold takes the following form:
RPr = OGPn + VPrT – OGPk , where
Rpr – sold products;
OGPn, OGPk – balances of finished products at the beginning and end of the study period;
VPRT – production of commercial products.
The following equality holds here:
RPR = OtgrPr , where
Rpr – sold products, and OtgrPr – shipped.
If the enterprise has chosen another option - recognizing payment revenue - the following equality is satisfied:
RPr = OGPn + Tone + VPrT – OGPk – Current , where
OGPn, OGPk – balances of finished products at the beginning and end of the study period;
VprT – production of commercial products;
Ton, Current – balances of shipped goods according to data at the beginning and end of the period.
Definition
In essence, the volume of output should be understood as the summed amount of a commercial product produced over a specific period of time and expressed through various indicators. It is worth adding that the significance of a particular indicator can be justified from two points of view:
- Strategic point of view. The point is what the company is positioning. It is this that provides the conditions necessary for concluding contracts and promoting the product on the market.
- Financial point of view. The indicator is considered a key volumetric value that characterizes the scale of the company’s production work. The commercial structure undertakes to provide such information to higher-level founders, organizations, investors and other users.
Analysis of product sales, overall profitability of sales
In general, the volume of products sold can be calculated using the formula:
ORPr = KPr(x) * TsPr(x) , where
KPr(x) – quantity of products of type x;
TsPr(x) – price of product type x.
Example. During the quarter, the plant produced 200 parts A at a price of 200 rubles and 400 parts B at a price of 100 rubles. This means that the volume of products sold in monetary units was:
200 * 200 + 400 * 100 = 80,000 rubles.
This so-called absolute indicator is compared with planned values and levels of previous periods, and growth and growth rates are also calculated from it.
But, as you know, analysis is not limited to the study of absolute indicators. For a more reliable assessment of the enterprise's performance, relative indicators are needed to demonstrate the effectiveness of certain actions. When studying sales volumes, this coefficient is the total return on sales, which is calculated as follows:
RentPr = PPr/Vyr , where
PPr – profit from sales;
Vyr – revenue.
Depending on the purposes of the study, the indicators in the numerator may change. For example, if it is necessary to determine net profitability, then net profit is used instead of operating profit.
Profitability is also studied in dynamics and in comparison with planned values. The factors influencing it are studied. Thus, under other constant circumstances, an increase in the selling price of a unit of a product always leads to an increase in profitability.
Assessment of the dynamics of the volume of products sold
The volume of products sold is generally calculated using the following formula:
ORPr = Vpr + OGPrn – OGPrk , where
ORPR – sales volume;
Vpr – gross product;
OGPRn, OGPRk - the balances of the finished product, respectively, at the beginning and end of the period (usually a year).
The formula contains the concept of gross product. This definition is worth understanding in more detail.
Gross product is the cost of all manufactured products (work performed) for a specific period, including production that has not yet been completed.
Along with this concept, there is also a commodity product - this is the volume of products that are ready for sale, that is, processed accordingly.
In some cases, the volumes of gross and commercial output are equal.
Example. The annual output of products at the plant amounted to 400,000 rubles. At the same time, the balance of finished products at the beginning of the year amounted to 45,000 rubles, and at the end - 70,000 rubles. Accordingly, the annual sales volume is calculated as follows:
400,000 + 45,000 – 70,000 = 375,000 rubles.
Sales volume indicators are studied in dynamics over a certain period. Let's look at how this happens using a specific example. Sales data for the drilling equipment plant over the five-year period are presented in the table.
| Quantities | 1st year (base) | 2nd year | 3rd year | 4th year | 5th year |
| Comparison with base period (%) | 100 | 109,7 | 122,2 | 133,2 | 151 |
| Comparison with the previous period (%) | — | 109,4 | 111,6 | 110,1 | 110,4 |
The average annual growth rate is calculated using the weighted average as follows:
Т = N√Т1*Т2*Т3*…ТN
Substituting the numbers from the table into the formula, we get:
4√1,094*1,116*1,101*1,104 = 1,104 = 110,4%
We conclude that over the five-year period, sales volume increased by 51% with an average annual growth rate of 10.4%.
Product competitiveness
The realities of the modern market for goods and services provide a high level of competition. It has long been not uncommon for any enterprise to have an entire sales department on staff. It’s also not easy for the marketing department, whose tasks include constant monitoring of the market for the company’s core products and services. Considering competitiveness as an integral factor of profit, we distinguish between the level of consumer interest in the enterprise itself and the quality of its products.
The competitiveness of a company is determined by the capabilities of its production in terms of quality level, the ability to produce certain volumes of products for the purpose of making a profit. It is through the effective distribution and utilization of capacity that the level of income of the enterprise as a whole directly depends on comparison with similar specialized companies on the market.
Output
The competitive advantages of a product are determined by its ability to satisfy the buyer according to most preferences. These parameters undoubtedly include the classic ratio of cost and quality, as well as the exact characteristics that determine its direct use by the consumer.
The practice of business entities shows that companies are not always able to produce truly competitive products. In this regard, enterprises structure their assortment. It can include both high-quality goods and products designed for the budget consumer class (mass production). The production of lower-class products is often used as a way to maintain the enterprise at the necessary, vital level. Also, mid-price products are used as an alternative to a high but costly level of production, and help increase its sales.
At the same time, the strategy of selling only competitive goods often not only does not stand up to criticism, but also prevents the company from staying afloat. A limited range of commercial products usually makes an enterprise an outsider in the market.
If we consider ideal competitiveness, an enterprise must have at least a unique product. This requires technology and modernized production. Only concerns can afford such innovations. An innovative product that has no analogues can be truly competitive.
Conclusion: to the key parameters of competitiveness, such as service, price and quality, it is necessary to add a degree of innovation.
Methods to increase the level of competitiveness:
- New developments in accordance with client (consumer) requests
- Introduction of innovative technologies not only to improve the characteristics of the product, but also in its production
- Permanent reduction in production costs
- Adequate pricing. Product cost will always remain the dominant factor for the consumer
- Search and development of new raw materials sources and sales channels
Disclosure of reserves for increasing sales volumes
The final goal of all analytical actions is to identify reserves for growth in sales volumes. This is necessary both to increase profits (profitability) and to reduce the balance of finished products in the warehouse (and, accordingly, reduce the cost of their maintenance, reduce the risk of damage, etc.).
Such reserves can be hidden in increasing the selling price, increasing production volumes to an optimal value (ensuring maximum profit at appropriate cost levels), advertising campaigns, searching for regular reliable customers (and strengthening relationships with them by providing discounts for “loyalty”, for example).
Reflection of sales of finished products in accounting
When shipping products to the buyer, the following posting is made:
Dt 62 “Buyers” Kt 90.1 “Sales, revenue”.
Further accounting entries depend on the cost at which the enterprise records products - actual or planned.
In the first case (if goods are accepted for accounting at actual cost), write-off is carried out through the following posting:
Dt 90.2 “Cost of sales” Kt 43 “Finished products”.
For the second option, if products are accounted for in standard quantities, entries are made using account 40 “Product Output”.
Dt 43 Kt 40 – products are accepted for accounting at planned cost;
Dt 90.2 Kt 43 – write-off of products (at planned cost);
Dt 40 Kt 20 “Production” - a reflection of the actual cost calculated at the end of the month;
Dt 90.2 Kt 40 – overexpenditure is written off, the excess of the actual cost over the planned one;
Dt 90.2 Kt 40 STORNO - savings are reflected, that is, the excess of the planned cost over the actual one.
Operations that are directly related to the process of selling manufactured products are accounted for using account 44 “Sales expenses”.
Calculation in natural values
An equally important aspect of the issue is the expression of output using a formula that involves the use of natural values. This technique is used in the process of analyzing output and sales volumes. In accordance with the varieties and categories of a homogeneous product. So, you can determine the volume of production using the formula:
Def = K x C,
where K is the number of units of commercial products produced, and C is the cost of one product.
For example, during the period under consideration, 100 parts were produced. The price of each of them is 200 rubles. And 500 parts, the price of which is 300 rubles. Accordingly, the total output according to the formula will be 170 thousand rubles. The calculation will be as follows: 100 x 200 + 500 x 300.
Volume of product sales in the balance sheet (line)
The balance sheet does not provide a separate line to reflect revenue (or the volume of goods sold). After all, this form of reporting shows the company’s assets, but the sold products, in essence, are no longer assets.
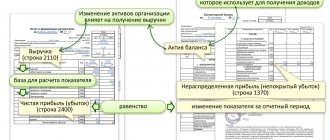
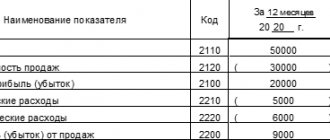
But the revenue is reflected in form number 2 - the Profit and Loss Statement. Here it is shown on line 2110 of the same name.
The balance sheet may reflect products that have already been shipped to the buyer (a sales contract has been concluded with him), but the money for it has not yet been credited to the account. In this case, the organization has accounts receivable, which are shown on the balance sheet line of the same name 1230. It is important to understand that in the balance sheet, revenue on this line is entered with VAT, while in the profit and loss statement a net indicator is used: revenue cleared of tax.
Profit from the sale of the product is reflected in balance sheet line 1370 “Retained earnings/uncovered loss.” Here, the operating profit is supplemented by the profit received from other operations in all types of activities of the company (both main and other).
How to calculate the volume of products sold according to the balance sheet
Reporting is the main source of information for analyzing all the economic characteristics of any enterprise. After all, it presents the final indicators for the time period under study.
To calculate the volume of goods produced and sold using reporting forms, we will need the following lines:
- 2110 “Revenue” from the income statement;
- 2120 “Cost of sales” from the income statement;
- 12105 “Inventories” from the balance sheet.
The volume of products sold is equal to the number on line 2110 of the second form.
Production volume is calculated as follows:
the amount on line 12105 at the end – the amount on line 12105 at the beginning + the amount on line 2120.