Hello, Vasily Zhdanov, in this article we will look at the calculation of liquidity indicators according to RAS. Each business entity has data on its assets (property) and liabilities (sources of property). At the same time, some pieces of property can be easily sold if necessary, but selling others will take a lot of time, or it may not be possible to sell them at all. At one time, a company's obligations can be long-term or short-term - that is, some debts need to be repaid in the near future, while others can be covered over a long period. To understand what portion of short-term debts can be repaid if a set of assets characterized by a certain rate of sale is sold, liquidity indicators are calculated.
Liquidity of a commercial enterprise: definition, classification
In the broadest sense, liquidity is the ability of the object of study to be converted into cash. If we talk about the efficiency of a commercial organization, liquidity refers to the ability of any asset (or an entire company, i.e., the totality of all available assets) to be sold in a short time at a price close to the market one . And the liquidity of a product is the possible speed of its sale at a nominal price.
Take our proprietary course on choosing stocks on the stock market → training course
From the definition of the concept of “liquidity” we can conclude that an asset will be considered the more liquid, the easier and faster it can be sold, while gaining its full value. Thus, values are usually divided into:
- illiquid (which are either completely impossible to sell or very difficult to sell),
- low-liquidity (implementation of which is possible, but difficult, and it will take a lot of time) and
- highly liquid (the sale of which is possible in a short time).
What is liquidity in simple words
Liquidity is the ability of assets to be converted into cash without any loss. The faster an asset is converted into money, the more liquid it is.
The easiest way to understand the essence of this term is with a simple example. Let's say you have several assets: real estate, a demand bank deposit and securities. Which one will be more liquid? To answer this question, you need to understand which of the following can be realized faster or converted into cash without loss? It is currently quite difficult to sell real estate; in addition, this will require costs for paperwork, etc., not to mention significant time costs.
As for the possibility of selling securities, this is influenced by many factors: their type, maturity date, market situation, exchange rates, quotes, etc. In any case, it is obvious that their implementation will require significant moral and financial costs.
A demand deposit involves investing funds in a bank with the possibility of withdrawing them at any time. Accordingly, this asset is the most liquid, since you can convert your investment into cash in the shortest possible time without incurring any costs. And if you may need money in the near future, then it is the best option offered.
Here we note one of the central rules in investing related to the concept of liquidity: the higher the level of liquidity, the lower the profitability and the lower the risk.
Let's look at our example. A demand deposit, as we found out, is the most liquid asset. At the same time, it is also the least profitable. As a rule, the interest rate in banks is minimal. Accordingly, this asset is also the least risky. Those. the risks of losing money in this case are reduced to almost zero.
Investments in real estate are more profitable, but also riskier. There is always a possibility that home prices will fall in value. Finally, investing in securities is the riskiest type of investment. After all, it is extremely difficult to determine how, for example, stock quotes on the stock exchange will change. Accordingly, the highest risks are observed here. Risk, therefore, acts as a price for high income.
Knowing the basics of liquidity is important not only for individual investing, but also for the functioning of banks and companies.
Balance sheet liquidity, grouping of balance sheet assets and liabilities
Let's consider the order of grouping Assets and Liabilities of the balance sheet of a Russian enterprise - Assets are arranged from most to least liquid, and the order of arrangement of Liabilities depends on the urgency of repaying the company's obligations:
| Grouping of Assets in the Balance Sheet | Grouping Liabilities in the Balance Sheet | ||
| A1 | Highly liquid (money, short-term investments) | P1 | The most urgent obligations (current accounts payable to counterparties, banks, employees, etc.) |
| A2 | Quickly realizable (short-term “receivables” - debts to the company, payments for which must be received no later than 1 year after the reporting date) | P2 | Medium-term liabilities (short-term loans and borrowings, reserves for future expenses, other short-term debts) |
| A3 | Slowly realized (current assets not included in groups A1, A2) | P3 | Long-term liabilities (liabilities taken from section IV “Long-term liabilities”) |
| A4 | Hard to sell (non-current assets - all) | P4 | Constant liabilities (company's own funds) |
According to the Balance Sheet, you can understand whether it is liquid by comparing the results for each of the groups of Assets and Liabilities. The following situation indicates absolute liquidity:
| Inequality | What does it mean |
| A1 > P1 | If you sell existing highly liquid assets, the company will be able to pay off its most short-term obligations. |
| A2 > P2 | After selling the company's quickly salable property, it will be possible to repay debts with an average repayment period. |
| A3 > P3 | With the proceeds from the sale of slowly selling assets, it is possible to pay off debts with a repayment period of more than 1 year. |
| A4 < P4 | The total value of an enterprise's hard-to-sell assets is less than the total amount of its equity capital. |
Liquidity analysis
Liquidity analysis includes:
- analysis of liquidity of the organization's balance sheet
- calculation of liquidity ratios
It is required:
- internal users for monitoring and making management decisions internally,
- external users (investors, suppliers, banks, etc.) in order to determine profitability, solvency, and evaluate the effectiveness of investments.
Balance sheet liquidity analysis
Balance sheet liquidity is one of the important financial indicators of an organization. It determines the degree of its solvency, that is, the company’s ability to cover its obligations to creditors with the help of its assets (whether the company has enough money to pay off its debts). In other words, if a company has enough cash in its accounts, it can pay on time without any problems. Also, having inventories that are easy to sell, an organization can pay off in a short time or get a bank loan against them. If the organization's assets only have a building, then it will be difficult for it to quickly sell it in order to pay off its debts. The higher the balance sheet liquidity, the faster the speed of debt repayment. Low balance sheet liquidity is the first sign of bankruptcy risk.
Indicators for calculating balance sheet liquidity indicators can be calculated using an online liquidity calculator.
To analyze liquidity, all assets are divided according to the degree of their realizability , and liabilities - according to the degree of urgency of repayment.
Description of the formation of groups of assets and liabilities based on the balance sheet in the form from 2022:
Assets:
- A1 - highly liquid assets: cash (line 1250) and short-term financial investments (line 1240).
- A2 - quickly realizable assets: short-term receivables (line 1230).
- A3 - slowly selling assets: inventories (line 1210), VAT (line 1220), other current assets (line 1260) minus deferred expenses (line 12605).
- A4 - hard-to-sell assets: non-current assets (line 1100).
Liabilities:
- P1 - urgent liabilities: accounts payable (line 1520).
- P2 - short-term liabilities: short-term loans and borrowings (line 1510), debt to participants for dividends (line 1540) and other obligations (line 1550).
- PZ - long-term liabilities: long-term loans (line 1400).
- P4 - permanent liabilities: the organization's own capital (line 1300), including deferred income (line 1530) minus deferred expenses (line 12605).
Balance sheet liquidity assessment
To assess balance sheet liquidity, it is necessary to conduct a comparative analysis between the size of assets and liabilities of the corresponding groups. The balance is considered absolutely liquid if the following conditions are met:
- A1 > P1 - The company can pay off the most urgent obligations with the help of absolutely liquid assets.
- A2 > P2 - An enterprise can pay off short-term obligations to creditors with quickly realizable assets.
- A3 > P3 - The enterprise can repay long-term loans with the help of slowly selling assets.
- A4 ≤ P4 - This inequality is satisfied automatically if all three inequalities are met. The enterprise has a high degree of solvency and can pay off various types of obligations with the corresponding assets.
Comparing A1 and A2 with P1 and P2 allows us to find out current liquidity, and A3 and A4 with P3 and P4 - prospective liquidity.
Analysis of balance sheet liquidity allows you to determine the availability of resources to pay off obligations, but does not allow you to accurately determine the solvency of the enterprise. For this purpose, relative liquidity indicators .
Liquidity indicators
Absolute liquidity ratio
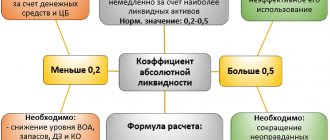
The absolute liquidity ratio shows what part of short-term liabilities can be repaid on a specific date. Recommended value is 20%.
- Calculation formula: K = A1/(P1+P2) = (Ds + Kfv) / KO
- Where:
- Ds - cash;
- Kfv - short-term financial investments;
- KO - current short-term liabilities minus future income.
Quick ratio
The quick ratio shows what portion of short-term liabilities can be repaid using cash and earnings. The recommended value is 100%. The optimal value in practice is a coefficient of 0.7.
- Calculation formula: K = (A1+A2)/(P1+P2)= (Kdz + Kfv + Ds) / KO
- Where:
- Ds - cash;
- Kdz - short-term receivables;
- Kfv - short-term financial investments;
- KO - current short-term liabilities.
Current ratio (coverage ratio)
The current liquidity ratio (coverage ratio) shows what part of short-term liabilities can be repaid using current assets. Recommended value If this indicator is below 1.5. This means that the company is not able to pay all its bills on time.
- Calculation formula: K = (A1+A2+A3)/(P1+P2)= OA/KO
- Where:
- OA - current assets;
- KO - short-term liabilities.
General indicator of liquidity of the enterprise's balance sheet
The overall liquidity indicator of an enterprise's balance sheet shows the share of payment by the enterprise of all existing obligations. This indicator is calculated when choosing a reliable partner from a variety of potential partners based on financial statements. The recommended value should be greater than or equal to 1.
- Calculation formula: K = (A1 + A2/2 + A3/3) / (P1 + P2/2 + P3/3)
Own funds ratio
The equity ratio shows how sufficient the enterprise's own working capital is, which is necessary for its financial stability. The recommended value should be greater than or equal to 0.1.
- Calculation formula: K = (P4 - A4) / (A1 + A2 + A3)
Functional capital agility coefficient
The functional capital agility ratio shows how much of the operating capital is contained in inventories. If this indicator decreases, then this is a positive fact. The indicator should tend to zero.
- Calculation formula: K = A3 / [(A1 + A2 + A3) - (P1 + P2)]
In custody
When analyzing liquidity, each indicator is calculated at the beginning and end of the reporting period. If the actual value of the coefficient does not correspond to the recommended value, then it can be assessed dynamically (increasing or decreasing the value).
Indicators for calculating balance sheet liquidity indicators can be calculated using an online liquidity calculator.
At the same time, there is no need to strive to ensure high liquidity of the enterprise’s balance sheet. It is important to determine the optimal level of liquidity, since excess liquidity can lead to a decrease in profitability, and insufficient liquidity can lead to both insolvency and possible bankruptcy.
To assess financial and economic activities, a system of indicators is used that can be calculated based on financial reporting data:
- vertical and horizontal analysis,
- liquidity indicators,
- financial stability indicators,
- business activity analysis,
- profitability indicators.
Liquidity ratios: types, meaning, interpretation
The calculation of liquidity ratios is carried out in order to obtain characteristics of a legal entity’s ability to fulfill all its obligations at the expense of everything it owns.
The purpose of liquidity indicators is to compare the value of an enterprise's assets with the amount of short-term debts at the same date. In other words, each liquidity ratio shows how much of the existing short-term debt could be covered by selling each set of assets.
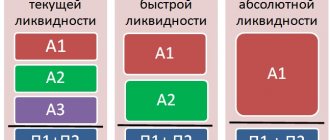
The property owned by a business entity can be divided into 3 categories depending on the possible speed of its sale. Based on this gradation, 3 liquidity indicators were introduced:
- Quickly realizable assets (money, short-term investments). The absolute liquidity ratio is calculated from their value.
- Assets that are sold fairly quickly (accounts receivable with a short repayment period). The average liquidity indicator is calculated from the amount of quickly sold and fairly quickly sold assets.
- Relatively quickly realizable assets (company inventories). The value of the total liquidity indicator is calculated from the total value of all current assets.
So, liquidity ratios are designed to demonstrate the following points:
- The current liquidity ratio shows how many rubles of current assets are per 1 ruble of current liabilities.
- The absolute liquidity ratio shows what proportion of a firm's short-term debt can be repaid with cash and cash equivalents in the form of marketable securities and deposits.
- The total liquidity ratio shows whether current debts can be repaid through the sale of current assets.
To summarize, the calculation of liquidity ratios is necessary for analysts who want to get an idea of the company's ability to repay its debts in a time-bound manner. An expert who has such data can find out whether the enterprise under study is solvent, what is the dynamics of its solvency in retrospect, and what are the forecasts for this organization .
How to calculate the liquidity indicators of an enterprise using general formulas and the balance sheet
For each liquidity indicator, the following statement is true: the liquidity ratio is calculated as the ratio of the cost of a certain type of property (according to the classification according to the period of sale) to the amount of short-term liabilities. Information for carrying out calculations can be found in the company’s balance sheet (usually for this purpose an aggregated form is compiled - enlarged, generalized).
Important! Information on current liabilities can be determined as a result of Section V, but only if provisions and deferred income are not material, they are not actually debt.
If the values of estimated liabilities and the amount of future income on the balance sheet take on significant values, in the formulas for calculating indicators, the amount of debts to creditors and obligations on borrowed funds, taken according to the lines of Section V, should be used:
| General formula | Balance formula |
Calculation of liquidity indicators (current liquidity)
The current liquidity ratio (coverage ratio, total liquidity ratio, CR - current ratio) is a financial indicator that reflects the company’s ability to pay off short-term debts by selling its current assets (all or only some). By the value of the current liquidity indicator, you can determine whether the organization is solvent.
The total liquidity indicator is calculated as the ratio of the company’s current assets and its current debts:
Important! From the amount of current assets participating in the formula presented above, it is necessary to exclude long-term accounts receivable (it was indicated in the Balance Sheet until 2011).
The economic interpretation of current ratio values is quite simple:
- the value of the indicator within the interval 1.5-2.5 is considered normative in world practice (varies depending on the field of activity);
- for enterprises in the Russian Federation, the normative value is CR>2;
- if CR>3, this most often indicates that the company’s managers are irrationally structuring the enterprise’s capital;
- a coefficient value of less than 1 indicates the presence of a large financial risk, because the company is unable to repay its debts consistently.
Analysis of liquidity of an enterprise’s balance sheet using financial ratios
Analysis of financial ratios is more complete and detailed compared to absolute indicators. Estimated ratios below standard indicators indicate that the enterprise does not have sufficient funds to cover its obligations. Excessive excess of standards indicates inefficient use of capital. The figure shows the six main balance sheet liquidity ratios.
Calculation of liquidity indicators (quick liquidity)
The quick liquidity ratio (quick liquidity ratio, intermediate liquidity ratio, QR - quick ratio) is a financial indicator that reflects the ability of an enterprise to repay all existing current obligations in a situation where, for some reason, it was not possible to sell manufactured products.
This indicator is calculated as the quotient of highly liquid current assets and current liabilities (liabilities with a short deadline):
Important! Unlike the case with the calculation of the current liquidity ratio, when calculating the quick liquidity indicator in the composition of assets, inventories (inventories) are not taken into account, since if they are sold due to the great need for cash, in comparison with other working capital they will be maximum losses for the company.
If the value of the quick liquidity ratio turns out to be equal to one or greater than 1, this is a good sign.
Analysis of liquidity of the enterprise balance sheet: theoretical aspect
The company converts its current assets into money, which it then uses to pay off its debts (satisfies the payment demands of creditors, pays staff, etc.).
Balance sheet liquidity is the ability of an enterprise to convert assets into cash and pay off its payment obligations. Moreover, the period for converting assets into money must correspond to the period for repaying liabilities.
The purpose of balance sheet liquidity analysis is to assess the ability of an enterprise to timely and fully fulfill short-term obligations at the expense of current assets. Balance sheet liquidity refers specifically to the ability of an enterprise to convert its assets into cash to pay off liabilities. There is a direct dependence of the number of means of payment on the number of short-term debt obligations.
The essence of the analysis of the liquidity of the balance sheet of an enterprise is to compare the funds on the asset, grouped by the degree of decreasing liquidity, with short-term liabilities on the liability, grouped by the degree of urgency of their repayment.
Calculation of liquidity indicators (absolute liquidity)
The absolute liquidity ratio is an economic indicator that has not found recognition in the West, showing whether an enterprise is solvent or not, namely, whether the company is able to pay off debts whose maturity is less than 1 year.
The absolute liquidity indicator is calculated by dividing the amount of funds available to the company and financial investments made for a short period by the amount of all obligations with a short deadline:
Important! As part of the assets participating in the above formula for calculating absolute liquidity, only money and assets that are close in nature to cash are subject to accounting.
Based on information from regulations relating to Russian enterprises, the standard value of the absolute liquidity indicator is a value of 0.2 and above.
Standard values of liquidity indicators: economic interpretation
Let's consider what the standard values of each of the liquidity ratios of organizations are, and how to correctly interpret them:
| Liquidity ratio | Normative value | Economic interpretation |
| Total liquidity ratio | Greater than or equal to 1, but not much greater than 1. | A value equal to 1 or slightly greater than 1 indicates that short-term debts can be repaid after the sale of current assets. If the value is significantly higher than 1, the company's owners are using available working capital ineffectively. |
| Absolute liquidity ratio | From 0.2 to 0.5. | If the value of the indicator is within the specified limits, it means that the owner can repay 20-50% of short-term debts in a short time. |
| Quick liquidity ratio | From 0.7 to 1. | The company has the ability to quickly pay off 70-100% of short-term debts. |
Determination of balance sheet liquidity
Approximate liquidity assessment
To correctly determine liquidity, you need to compare the assets and liabilities of the corresponding groups:
- A1 must be greater than P1;
- A2 must exceed P2;
- A3 should be higher than P3.
If all 3 conditions are met, then A4 will definitely be less than P4. Such a ratio will mean the presence of current assets, that is, the minimum sufficient requirement to state the financial stability of the company is met.
REFERENCE! It is convenient to format data for analysis in the form of a so-called “coverage table”, where the difference between assets and liabilities of each degree of liquidity and maturity is considered at the beginning of the year and the final date of the reporting period.
An example of calculating liquidity indicators of an enterprise
Let’s imagine that we know some data from the Balance Sheet of a hypothetical LLC “The Prince and the Pauper”:
| Balance sheet data | Amount (rubles) |
| Fixed Assets (Fixed Assets) | 376 000 |
| Cash (DC) | 171 000 |
| Intangible assets (IMA) | 145 000 |
| Inventory (Inventory) | 269 000 |
| Accounts receivable (RE) | 231 000 |
| Short-term financial investments (SFI) | 138 000 |
| Short-term loans (CC) | 204 000 |
| Long-term loans (LC) | 216 000 |
| Long-term loans (DoZ) | 291 000 |
Let's calculate the liquidity indicators of Prince and the Pauper LLC:
| Liquidity ratio | Calculation formula | Interpretation of values |
| Absolute liquidity ratio | K1 = (171 + 138) : (216 + 204) = 0.7357 | A value of more than 0.2 is considered normal. The company will be able to cover 73% of its debts using existing cash in its accounts. |
| Quick liquidity ratio | K2 = (171 + 138 + 231) : (216 + 204) = 1.2857 | The value must be at least 0.8. If the company decides to use all its funds, including accounts receivable, this amount will be 1.28 times the total amount of debts. |
| Critical liquidity ratio | K3 = (171 + 138 + 231 + 269) : (216 + 204) = 1.9261 | The value is much higher than 1, which means that the company is probably not managing its working capital wisely. |
Answers to frequently asked questions about calculating liquidity ratios
Question: What liquidity indicator most accurately characterizes the degree of solvency of a company that is part of a holding group?
Answer: It is advisable to identify the level of solvency based on the values of the absolute liquidity indicator. At the same time, when calculating the value of the liquidity ratio, it is not necessary to take into account the amounts of internal receivables and payables.
Question: Are illiquid inventories taken into account when calculating the current ratio?
Answer: No, illiquid inventories should not be taken into account.
Forecasting liquidity ratios
Analysis of the dynamics of changes in the indicator over several reporting periods allows us to predict its further changes. We made a forecast of changes in the current liquidity ratio for 2013-2018. Calculations were made on the basis of financial statements from the database of the Federal State Statistics Service of the Russian Federation.
Table 8 – Calculation of the current liquidity ratio of T2 MOBILE LLC, thousand rubles.
| Index | 2013 | 2014 | 2015 | 2016 | 2017 | 2018 |
| Cash | 52 | 4092 | 361240 | 261420 | 1012750 | 339186 |
| Financial investments | 0 | 90410 | 1679738 | 0 | 0 | 44519 |
| Accounts receivable | 3 | 2606096 | 18530596 | 10959253 | 8344749 | 10524571 |
| Reserves | 0 | 1113358 | 602339 | 1210383 | 1009503 | 524913 |
| Value added tax | 0 | 80809 | 472530 | 262037 | 234215 | 200262 |
| Other current assets | 0 | 167188 | 1449625 | 928035 | 1473026 | 983495 |
| Total current assets | 55 | 4061953 | 23096068 | 13621128 | 12074243 | 12616946 |
| Borrowed funds | 0 | 3820188 | 3599088 | 9122134 | 13391017 | 14617288 |
| Accounts payable | 146658 | 3543312 | 36182276 | 30565227 | 22402760 | 31099825 |
| Total current liabilities | 146658 | 7363500 | 39781364 | 39687361 | 35793777 | 45717113 |
| Current ratio | 0.00 | 0.55 | 0.58 | 0.34 | 0.34 | 0.28 |
The figure shows the dynamics of changes in the current liquidity indicator for 2013-2018.
The figure shows that there is an increasing trend in the current liquidity ratio. Moreover, the value of the coefficient throughout the analyzed period is much lower than the standard value.