Current ratio. Balance calculation formula
Current ratio is the ratio of highly liquid assets, quickly marketable assets and slowly convertible assets to the most urgent liabilities and medium-term liabilities. This indicator is one of the three main criteria characterizing the liquidity of an enterprise. Liquidity, as a rule, is equated to the solvency and ability of an enterprise (firm, company) to sell assets at a market price. The concept of liquidity comes from the term liquidate, that is, sell. Liquidity is one of the key concepts of financial analysis and shows the rate at which assets are converted into money.
Take our proprietary course on choosing stocks on the stock market → training course
Below is a classification of the types of assets and liabilities of an enterprise used to assess liquidity.
A1 = Highly liquid assets (line 1250)
A2 = Quickly realizable assets (line 1230)
A3 = Slowly convertible assets (line 1220)
—————————————————————
P1 = Most urgent obligations (p. 1520)
P2 = Medium-term liabilities (line 1510)
As a result, the analytical formula for assessing current liquidity has the following form:
| Business valuation | Financial analysis according to IFRS | Financial analysis according to RAS |
| Calculation of NPV, IRR in Excel | Valuation of stocks and bonds |
What does a negative current ratio show?
In the literal sense, the value of the indicator cannot be a negative number - it can be small down to one ten-thousandth. Progressive negative dynamics of the value indicates the following:
- incorrect financial policy of the company and distribution of funds;
- oversaturation of obligations to creditors;
- large volume of unsold products;
- about excessive investment;
- the presence of a large number of debts outstanding to the company.
- probable imminent bankruptcy.
Current ratio standard
If the current ratio is greater than 2, this indicates that the company has more current assets than short-term liabilities with double coverage. An enterprise (company) has a high ability to pay off its obligations (debts) in the short term. The standard value of current liquidity equal to 2 was obtained in practice and is most often found in domestic regulations.
In world practice, the optimal coefficient is considered to be in the range from 1.5 to 2.5. If the current liquidity ratio is less than 1, then the enterprise cannot reliably pay off short-term obligations. The table below presents a comparison of domestic and international standards and the level of solvency of the enterprise.
| Indicator values | Standards | |
| Russian | International | |
| <1 | Critical solvency | Critical solvency |
| 1,5-2 | Low solvency | Satisfactory solvency |
| 2-3 | Satisfactory solvency | |
| >3 | High solvency / Possible irrational capital structure | |
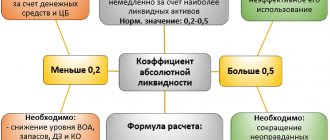
Absolute liquidity ratio
Along with the current liquidity ratio, analysts use another indicator in their activities - the absolute liquidity ratio. What is it?
The absolute liquidity ratio is a financial instrument that is equal to the ratio of cash and short-term financial investments that the company makes to short-term liabilities (the current level of liabilities).
The data for calculating the absolute liquidity indicator is the organization’s balance sheet (according to accounting form No. 1).
Today, there are a large number of application programs that allow you to quickly and easily calculate any ratio and draw conclusions about the company’s activities.
The absolute liquidity ratio shows what percentage of short-term debts can be covered by the enterprise's cash resources and their equivalents in the form of deposits, securities or other highly liquid assets.
Calculations of the liquidity ratio are of interest not only to the company’s management, but also to other (external) entities:
- investors who monitor the current liquidity ratio before investing;
- suppliers of raw materials and components who decide to grant a deferred payment;
- bankers who are looking for guarantees for the return of short-term loan funds issued to a company.
The absolute liquidity ratio is calculated using the following formula: Klt=(cash resources + short-term financial investments)/current level of liabilities.
In foreign financial analysis of enterprises, a regulatory restriction on the absolute liquidity indicator is applied. Thus, the regulatory limit Klt is 0.2. This means that every day the company must be able to pay at least 20% of the amount of short-term financial obligations.
There is no exact justification for this standard value, however, most Russian calculations of the absolute liquidity indicator. Thus, evidence of the normal activity of the enterprise is the fact that the amount of own funds should cover 20% of current (short-term) liabilities. However, for some domestic companies, given the heterogeneity of the structure of short-term debt, the KLT indicator should be at least 0.5.
Labor intensity helps to determine the ratio of effort and time as accurately as possible. Labor intensity - calculation formula and specific index standards, read carefully.
Perhaps this information will be useful to you: calculation of the average number of employees and fines for failure to provide a document to the tax service.
Comparison of current ratio with other liquidity indicators
Take our proprietary course on choosing stocks on the stock market → training course
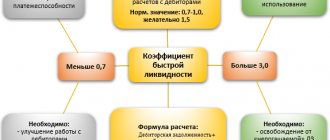
In addition to the current ratio, in the practice of financial analysis, the quick ratio and the absolute ratio are often used. They show the ability of an enterprise to repay its debt obligations with quickly realizable and highly liquid types of assets.
Thus, the absolute liquidity ratio shows the ability of an enterprise to pay off its debts using the most liquid assets (cash and short-term financial investments). That is, this indicator shows the maximum speed with which a company can pay off creditors (and other borrowers).
The quick liquidity ratio shows the ability of an enterprise to pay off its debts using not only highly liquid assets, but also quickly realizable ones - these are short-term receivables.
The diagram below shows the difference between liquidity ratios ↓
What is meant by balance sheet liquidity?
The term “liquidity of a company” is usually understood as its solvency, i.e. ability to timely repay current obligations. Surely you have heard the concept of “liquid assets”. These are assets that can quickly turn into money. Balance sheet liquidity refers to the level of coverage of liabilities by assets, i.e. how much working capital exceeds the creditor. That is why the indicator we are considering today is sometimes called the coverage ratio.
Some economists take into account the sum of all liabilities when calculating the indicator. This is not entirely correct - the current ratio shows the ratio of current liabilities and current assets. As for long-term accounts payable, in the event of unfavorable circumstances for the company, these debts can be repaid by selling non-current assets (i.e. fixed assets).
Thus, the current liquidity ratio is an indicator of the solvency of an enterprise at the current moment. It is calculated based on data on short-term liabilities and working capital.
How to calculate the current ratio for an industry?
Take our proprietary course on choosing stocks on the stock market → training course
The standard values are also influenced by the industry average values of the current ratio. We present an algorithm for calculating the current liquidity indicator for any industry.
Different industries may have different ratio values. To calculate industry average values, OKVED codes (Classifier of Activities) are used. Enterprises engaged in the same type of activity are grouped according to them, coefficient values are calculated from them and averaged.
For example, let's take enterprises in the oil and gas industry, enterprises will have the following types of activities.
| Activities: | Oil and gas industry, Petroleum products - sales, transportation, Oil and gas - production |
In addition to selecting enterprises using a single OKVED code, you should also select companies by size; for this we use the “Volume of sales revenue” indicator. This is done in order to make the sample for analysis as homogeneous as possible.
| Sales revenue (million rubles) | Enterprise classification by size |
| < 60 million | Microenterprises |
| 60 – 400 million | Small businesses |
| 401 – 1000 million | Medium enterprises |
| > 1000 million | Large enterprises |
The formula for calculating the current ratio for an industry is as follows:
Current liquidity ratio of the industry = Current liquidity ratios of the enterprise (for one OKVED code and Revenue volume) / Number of enterprises
For all similar enterprises based on the selected OKVED code and size, the current liquidity ratio is calculated and the arithmetic average is performed. The information system for data analysis – SPARK – is ideal for carrying out such analysis. To improve accuracy, you can assign different weights to different groups of enterprises.
Take our proprietary course on choosing stocks on the stock market → training course
Methods for assessing financial condition using the current liquidity indicator
Basic assessment methods involving the coefficient:
- Selezneva-Ionova model. The methodology is aimed at comparing actual indicators with the standard, identifying the profitability of assets in terms of their net income, as well as an overall assessment of the company's management.
- Saifullin-Kadykov model. Similar to the previous one, it may be true for analyzing the financial status of companies of various industries and sizes. The success of sales and turnover of your own budget is also calculated.
- Postyushkov's model. Suitable for assessing the prediction of the ruin of an enterprise with a prediction range of up to six months.
An example of analysis of the current ratio for JSC Transneft and the industry
The current liquidity ratio for 2009 for Transneft OJSC is 3.48, which is quite high according to general standards. Let's compare the enterprise with similar enterprises having a similar type of activity and size.
Type of activity of Transneft OJSC - Oil and gas industry, Petroleum products - sales, transportation, Oil and gas - production. For JSC Transneft, sales revenue exceeds 1000 million rubles. The final calculation of the industry average value of the indicator is presented in the table below.
The current liquidity value for similar enterprises was calculated and amounted to 2.76. As we can see, Transneft OJSC has a higher solvency in relation to the industry average. This indicates the good financial condition of this company.
An example of comparing the current ratio of an enterprise with its industry
| Indicator name | Company indicator value | The value of the indicator for OKVED : Transportation of oil and petroleum products through pipelines, Company revenue is more than 10,000 million rubles. | |
| Across Russia | Moscow city | ||
| Current ratio | 3,48 | 2,76 | 3,05 |
In addition to comparing with the industry average value of the current liquidity indicator, you can compare it with the indicator for a selected region, for example, Moscow, as one of the leading regions of Russia.
Liquidity ratios using the example of T2 MOBILE LLC: analysis and assessment
The main activity of T2 MOBILE LLC is activities in the field of communications based on wireless technologies. Based on the balance sheet from the database of the Federal State Statistics Service, we will calculate the liquidity ratios of the enterprise for 2017-2018.
Table 2 – Calculation of liquidity ratios of T2 MOBILE LLC
| Index | 2017 | 2018 | Change | Growth rate, % |
| Cash, thousand rubles. | 1012750 | 339186 | -673564 | 33 |
| Financial investments, thousand rubles. | 0 | 44519 | 44519 | X |
| Accounts receivable, thousand rubles. | 8344749 | 10524571 | 2179822 | 126 |
| Inventories, thousand rubles | 1009503 | 524913 | -484590 | 52 |
| Value added tax, thousand rubles. | 234215 | 200262 | -33953 | 86 |
| Other current assets, thousand rubles. | 1473026 | 983495 | -489531 | 67 |
| Total current assets, thousand rubles. | 12074243 | 12616946 | 542703 | 104 |
| Borrowed funds | 13391017 | 14617288 | 1226271 | 109 |
| Accounts payable | 22402760 | 31099825 | 8697065 | 139 |
| Total current liabilities, thousand rubles. | 35793777 | 45717113 | 9923336 | 128 |
| Current ratio | 0.34 | 0.28 | -0.06 | 82 |
| Quick ratio | 0.30 | 0.26 | -0.04 | 86 |
| Absolute liquidity ratio | 0.03 | 0.01 | -0.2 | 30 |
The liquidity situation is clearly shown in the figure below:
As a result of the analysis, the following was established. The values of all liquidity ratios of T2 MOBILE LLC in both 2022 and 2022. below standard. Moreover, in 2022, all indicators decreased compared to 2022. Thus, the current liquidity ratio decreased by 0.06 points (from 0.34 to 0.28), the quick liquidity ratio - by 0.04 points (from 0.30 to 0.26), absolute liquidity ratio - by 0.02 points (from 0.03 to 0.01). Such results prove the insolvency of the enterprise.
Factor analysis of current ratio
Having studied the dynamics of the coefficients, it is necessary to evaluate the factors of their change. This is necessary in order to identify the main reasons for the deterioration or improvement of the financial position of the enterprise and to justify possible options for management decisions. One of the most widely used methods of factor analysis is the method of chain substitution. This method is universal, as it is used in all types of factor models.
We will carry out factor analysis using the chain substitution method using the example of the current liquidity ratio. The data for analysis and the factor analysis itself are presented in the table below:
Table 3 – Factor analysis of the current ratio
| Index | Symbol | T0 | T1 | ± | % |
| Current ratio | KTL | 0.34 | 0.28 | -0.06 | 82 |
| Cash, thousand rubles. | DS | 1012750 | 339186 | -673564 | 33 |
| Financial investments, thousand rubles | FV | 0 | 44519 | 44519 | X |
| Accounts receivable, thousand rubles. | DZ | 9817775 | 11508066 | 1690291 | 117 |
| Inventories, thousand rubles | Z | 1243718 | 725175 | -518543 | 58 |
| Borrowed funds, thousand rubles. | Kr | 13391017 | 14617288 | 1226271 | 10 |
| Accounts payable, thousand rubles. | short circuit | 22402760 | 31099825 | 8697065 | 139 |
| Factor calculations: | |||||
| KTL0= DS0+FV0+DZ0+Z0)/(Kr0+KZ0) | 0.34 | ||||
| KTLlusl1=DS1+FV0+DZ0+Z0)/(Kr0+KZ0) | 0.32 | ||||
| KTLlusl2=DS1+FV1+DZ0+Z0)/(Kr0+KZ0) | 0.32 | ||||
| KTLlusl3=DS1+FV1+DZ1+Z0)/(Kr0+KZ0) | 0.37 | ||||
| KTLlusl4=DS1+FV1+DZ1+Z1)/(Kr0+KZ0) | 0.35 | ||||
| KTLlusl5=DS1+FV1+DZ1+Z1)/(Kr1+KZ0) | 0.34 | ||||
| KTL1=DS1+FV1+DZ1+Z1)/(Kr1+KZ1) | 0.28 | ||||
| Change in Ktl due to factors: | |||||
| cash: KLusl1 - KTL0 | -0.02 | ||||
| financial investments: KTLlusl2 - KTLlusl1 | 0.00 | ||||
| accounts receivable: KTLlusl3 - KTLlusl2 | 0.05 | ||||
| stocks: KTLlusl4 - KTLlusl3 | -0.01 | ||||
| short-term loans: KTLlusl5 - KTLlusl4 | -0.01 | ||||
| accounts payable: KTL1 - KTLlusl5 | -0.07 | ||||
| Balance of deviations | -0.06 |
T0 - 2022. T1 - 2022. “Accounts Receivable” includes line 1230 and line 1260. “Inventory” includes line 1210 and line 1220. “Accounts Payable” includes line 1520 and line 1550.
Thus, the current liquidity ratio in 2022 compared to 2022 decreased by 0.06 points and amounted to 0.28 versus 0.34 in 2022. This change was the result of the following factors:
- decrease in the amount of funds in the enterprise account -0.02
- increase in accounts receivable +0.05
- inventory reduction -0.01
- increase in the amount of short-term loans -0.01
- increase in accounts payable -0.07
Total: -0.06
The figure below shows the factors of change in the analyzed indicator. The factors indicated in the yellow cells (change in current assets and change in current liabilities) are first-order factors. The green and orange cells contain second-order factors that influence changes in current assets and current liabilities, respectively.
Liquidity ratios of enterprises of the Russian Federation and the telecommunications industry
Liquidity ratios for enterprises of the Russian Federation and the telecommunications industry for 2017-2018. were calculated on the basis of financial statements contained in the database of the Federal State Statistics Service of the Russian Federation. Let's compare the liquidity indicators of T2 MOBILE LLC with these indicators.
Table 4 – Liquidity ratios of T2 MOBILE LLC, enterprises of the Russian Federation and the telecommunications industry in 2017
| Index | Current ratio | Quick ratio | Absolute liquidity ratio |
| All enterprises of the Russian Federation | 1.37 | 1.02 | 0.11 |
| All industry enterprises | 1.57 | 1.24 | 0.17 |
| T2 MOBILE LLC | 0.34 | 0.3 | 0.03 |
Table 5 – Liquidity ratios of T2 MOBILE LLC, enterprises of the Russian Federation and the telecommunications industry in 2018
| Current ratio | Quick ratio | Absolute liquidity ratio | |
| All enterprises of the Russian Federation | 1.44 | 1.05 | 0.12 |
| All industry enterprises | 1.64 | 1.28 | 0.18 |
| T2 MOBILE LLC | 0.28 | 0.26 | 0.01 |
The figure below shows the liquidity situation for T2 MOBILE LLC, Russian enterprises and the industry in 2017-2018.
A comparison of the liquidity ratios of T2 Mobile LLC, Russian enterprises and the telecommunications industry showed the following. All liquidity indicators of T2 MOBILE LLC are below standard values, as well as similar indicators for enterprises of the Russian Federation and enterprises in the telecommunications industry.
Liquidity ratios of T2 MOBILE LLC and its closest competitors
The closest competitors of T2 MOBILE LLC are PJSC Mobile Telesystems and PJSC Vympel Communications. Let's compare the indicators of liquidity ratios of the analyzed enterprise with similar indicators of competitors. Calculations were made on the basis of data from the financial statements of enterprises contained in the database of the Federal State Statistics Service of the Russian Federation.
Table 6 – Liquidity ratios of T2 MOBILE LLC and its closest competitors in 2022
| Index | Current ratio | Quick ratio | Absolute liquidity ratio |
| T2 Mobile LLC | 0.34 | 0.3 | 0.03 |
| PJSC Mobile Telesystems | 0.67 | 0.64 | 0.44 |
| PJSC "Vympel Communications" | 1.38 | 1.32 | 0.75 |
Table 7 – Liquidity ratios of T2 MOBILE LLC and its closest competitors in 2022
| Index | Current ratio | Quick ratio | Absolute liquidity ratio |
| T2 Mobile LLC | 0.28 | 0.26 | 0.01 |
| PJSC Mobile Telesystems | 0.78 | 0.75 | 0.58 |
| PJSC "Vympel Communications" | 0.93 | 0.78 | 0.41 |
The figure below clearly shows the dynamics of changes in liquidity indicators.
As a result of the analysis, the following was established. The value of the current liquidity ratio of T2 MOBILE LLC does not reach the standard value throughout the analyzed period. Moreover, in 2022 the value of the indicator worsened from 0.34 to 0.28. This indicates that the company does not have funds to cover current obligations. The value of the current liquidity ratio of T2 MOBILE LLC is lower than similar indicators of all competing enterprises. Moreover, current liquidity ratios of competitors are also below the standard both in 2022 and in 2022.
The value of the quick liquidity ratio of the analyzed enterprise is lower than the standard value and similar indicators of competitor enterprises both in 2022 and in 2022. While the values of competitors' indicators generally correspond to the normative ones.
The same conclusion can be drawn when comparing the absolute liquidity ratio. The absolute liquidity ratio of T2 MOBILE LLC is much lower than the standard value and similar ratios of competitors both in 2022 and in 2022. At the same time, the absolute liquidity ratios of competing enterprises either correspond to or are higher than the standard.
Forecasting the current ratio
A point calculation of the current liquidity ratio cannot fully characterize the state of the enterprise. Therefore, it is necessary to analyze the dynamics of changes in the indicator over several reporting periods. This allows us to predict its further changes. The figure below shows the dynamics of changes in the current liquidity ratio and makes a forecast based on linear regression.
Dynamics of changes in the current liquidity ratio for Transneft JSC
As we can see, there is an increasing trend in changes in the current liquidity ratio. This indicates favorable programs for the financial rehabilitation of the enterprise, when in 2007 the indicator was less than 0.5, which does not correspond to the standards, whereas in 2010 it was higher than the standard value (equal to 2.1).
The essence of the concept of “liquidity ratios”
The liquidity ratio is a relative indicator expressed in fractions of units or percentages. It is obtained by dividing one absolute indicator by another absolute indicator.
Liquidity ratios are calculated based on the enterprise's balance sheet. To do this, individual groups of assets are gradually compared with short-term liabilities. And thus they determine the ability of the enterprise to repay current debts at the expense of existing current assets.
The relative liquidity indicators of the analyzed enterprise can be compared:
- with generally accepted standards for assessing the degree of risk and predicting bankruptcy
- with similar data from other enterprises, which allows you to identify the strengths and weaknesses of the enterprise and its opportunities
- with similar data for previous years to study trends in improvement or deterioration of the financial condition of the enterprise
Answers to frequently asked questions about calculating liquidity ratios
Question: What liquidity indicator most accurately characterizes the degree of solvency of a company that is part of a holding group?
Answer: It is advisable to identify the level of solvency based on the values of the absolute liquidity indicator. At the same time, when calculating the value of the liquidity ratio, it is not necessary to take into account the amounts of internal receivables and payables.
Question: Are illiquid inventories taken into account when calculating the current ratio?
Answer: No, illiquid inventories should not be taken into account.
Market
Liquidity is available not only for individual companies or banks, but also for entire markets - securities, services, and so on. The market will have high liquidity if transactions are regularly concluded on it, but the difference in the prices of buy and sell orders is small. Moreover, there should be many such transactions so that each individual transaction on the market does not have a significant impact on the price of the product.
Read more on this topic: Liquidity absorption or how the Central Bank regulates market liquidity.
What does liquid mean?
The easier it is to exchange a product for money, the more liquid it is considered. The concept of liquidity does not exist separately at all; it is always next to any subject. For example, industrial sewing machines have low liquidity - because they are difficult to sell quickly at real value. And food products such as meat, fish or eggs are easy to sell and have high liquidity .
Or another funny example. iPhones are very popular, they are easy to sell, which means they have good liquidity.
- Highly liquid – easy to quickly sell at market value (deposits, shares, bonds).
- Low liquidity - difficult to sell, you need to wait a long time for a buyer (real estate, business, goods). If you compare any product with securities, then all these iPhones are also low-liquid. Because selling a bond is much faster than selling an iPhone.
And now the most important thing:
Any asset has liquidity.
Translated from financial language - any valuable property.
Calculation of liquidity indicators (absolute liquidity)
The absolute liquidity ratio is an economic indicator that has not found recognition in the West, showing whether an enterprise is solvent or not, namely, whether the company is able to pay off debts whose maturity is less than 1 year.
The absolute liquidity indicator is calculated by dividing the amount of funds available to the company and financial investments made for a short period by the amount of all obligations with a short deadline:
Important! As part of the assets participating in the above formula for calculating absolute liquidity, only money and assets that are close in nature to cash are subject to accounting.
Based on information from regulations relating to Russian enterprises, the standard value of the absolute liquidity indicator is a value of 0.2 and above.
Money
The liquidity of money is maximum. Money is also an asset. They can always be exchanged for any material equivalent. Except for cases when they lose their meaning: during times of occupation, coups, hyperinflation, confiscation reforms and other force majeure circumstances. Then liquidity is retained by the currencies of other states or the money of the new state.
For example, USSR rubles lost their liquidity, and new Russian money appeared in their place. During the hyperinflation of the early 1990s, the liquidity of new money weakened. People tried to use them as quickly as possible to buy any product that was becoming more expensive every week. After the abolition of the Soviet article of the Criminal Code on criminal liability for foreign exchange transactions, the US dollar became a reliable currency with high liquidity.
Changes in the liquidity of money are also directly related to inflation: prices for goods rise simultaneously with the fall in the purchasing power of the national currency.
Bank liquidity
A bank's liquidity is its ability to quickly and timely fulfill any obligations it assumes. Banks with highly liquid investments and reserves have this opportunity. In this case, different assets can act as reserves, for example, shares and bonds.
To paraphrase in simple words, a bank cannot issue loans to everyone indiscriminately, relying only on the existing assets and funds of its own depositors. Since the bank must have available funds with which they repay their urgent obligations. And also the bank must have capital that will allow these deposits to be returned if they are requested earlier.
Therefore, banking organizations are regulated by the Central Bank. If the bank does not comply with the standards, the Central Bank fines the credit institution and issues a warning. And if this does not help to avoid further violations, then the license will be revoked altogether.