Absolute liquidity ratio: economic meaning of the indicator
The absolute liquidity ratio can also be called the cash ratio or cash liquidity ratio. The figure shows the general characteristics of the indicator. A detailed description of the indicator is given below.
The absolute liquidity ratio (K al) shows what part of the company’s short-term liabilities can be repaid in the shortest possible time using the most liquid assets. These include cash (in cash and in the accounts of the enterprise) and short-term financial investments. The indicator is obtained by dividing cash and short-term financial investments by short-term liabilities:
The coefficient under consideration is one of three criteria characterizing the liquidity of an enterprise. The larger it is, the higher the company’s reliability in the eyes of creditors and suppliers in terms of repaying obligations. The indicator is of greatest interest to suppliers of material resources.
Ready Cash Ratio
You can independently calculate the values of the Absolute Liquidity Ratio, or use a ready-made calculation. For each company, our algorithms calculate all coefficients and multipliers.
Use a stock screener to compare Cash Ratio between other companies in the industry, and in this case, add the “Absolute Liquidity Ratio” indicator yourself using the “Add Column” command in the screener.
A screener is a necessary investor tool that helps you invest your money correctly. From thousands of companies listed on the stock exchange, based on specified parameters, you select those that interest you.
Use the bubble chart in the company card in the Industry Score tab for a comparative analysis of the Absolute Liquidity Ratio. With Industry Analysis, you can visually evaluate and understand where the company you are investing in compares to other companies in the industry.
Also in the company card in the “Multipliers” tab, you can look at the Cash Ratio calculation over the dynamics of several years and understand how the company feels in relation to other years, as well as use other profitability ratios.
Absolute liquidity ratio: balance sheet formula
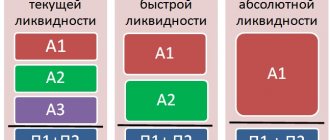
To assess liquidity, current balance sheet assets are grouped by degree of liquidity, and short-term liabilities are grouped by debt maturity dates (balance sheet line codes are indicated in parentheses).
Cash (line 1250) and short-term financial investments (line 1240) are among the most liquid assets and are included in group A1 . Cash is ready for payment and settlement at any time, therefore it has absolute liquidity. Securities and similar short-term financial investments can be easily sold on the stock exchange or other business entities. Therefore, they are also among the most liquid assets.
A1 = page 1240 + page 1250
Short-term balance sheet liabilities are ranked according to the degree of urgency of payment into the following groups:
Group P1 - the most urgent obligations. The basis of this group is accounts payable with a maturity of up to three months (line 1520), and other short-term liabilities (line 1550). Accounts payable are the debts of an enterprise to other persons, which it is obliged to repay. There are: debts to suppliers and contractors, to extra-budgetary funds, to the state for taxes and fees, to company personnel, etc.
P1 = page 1520 + page 1550
Group P2 – medium-term liabilities. This group is based on items of short-term borrowed funds (line 1510) and estimated liabilities (line 1540). The repayment period ranges from three months to one year. There are two types of borrowed funds: credits and borrowings. Loans are provided by specialized organizations at interest rates. Loans are issued by any legal entity or individual. Moreover, they can be interest-free.
P2 = page 1510 + page 1540
Then the formula for calculating the absolute liquidity ratio on the balance sheet will look like this:
or by balance line codes:
Formulas and standards
To understand how the liquidity ratio is calculated, you need to know the standard values of general indicators. It is advisable to sort the assets reflected in the balance sheets based on their turnover, as well as their ability to circulate in a minimum time period.
So, if you arrange the list in descending order, you get the following picture:
- Funds in the cash register or bank account of an organization.
- Bills of exchange, bonds and other types of securities.
- Customer debt, previously granted credits and loans, stock exchange shares.
- Commodity and raw materials warehouse stocks.
- Transport, operating systems and technical equipment.
- Real estate, including unfinished objects.
The more complex the sales procedure, the less valuable the property will be from the point of view of the balance sheet formula that determines the overall liquidity indicator.
Coverage ratio
An economic characteristic that reflects solvency and is calculated as the ratio of current assets to short-term liabilities of a legal entity. The calculation algorithm involves the use of data obtained from the balance sheet of the accounting department in Form No. 1 and inserted in a certain order.
That is, in the variant under consideration, the actual methodology, using rows of values for a visual calculation of commercial efficiency, expressed through the current ratio, may look like:
- KTL = fixed assets minus long-term receivables/debts with short closing periods.
- K = (290 - 230) / 690.
- K = 290 / (610 + 620 + 660).
- K = 1200 / (1520 + 1510 + 1550).
The resulting expression determines the solvent status of the organization by projecting a situation in which urgent repayment of existing obligations will be required using only working capital.
It is important to consider that the resulting result does not always objectively characterize the state of affairs - many companies prefer to work with reduced inventories, striving to improve turnover, and at the same time using bills of exchange to obtain money. This approach leads to an artificial understatement of indicators, while in practice the company demonstrates competent and correct business management.
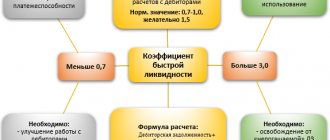
Quick liquidity ratio
This regulatory criterion is similar in its specifics to the previous one, since it also determines whether the enterprise is ready to repay existing short-term debts using current assets. The only but important difference is the use for calculations of only property assets belonging to the high and medium categories in terms of the speed of their potential conversion into cash.
In fact, in this case we are talking about the organization’s money under operational management, warehouse stocks of finished marketable products, as well as accounts receivable with minimum repayment periods. The list does not include production facilities with an unfinished full cycle, remnants of specific components, raw materials and semi-finished products, the sale of which will take a long time.
The source of data, as in the previous case, is the balance sheet, but this time inventories are not included in the composition, since their forced sale leads to the maximum possible losses. Based on this, the assessment is made in two ways:
- KBL = (cash + short-term investments + accounts receivable with minimum closing periods) / current financial liabilities.
- KSL = (assets - inventory balances) / debt load.
When substituting balance sheet lines from the standard first form, the following options will be obtained:
- K = (240 + 250 + 260) / (610 + 620 + 660).
- K = (1230 + 1240 + 1250) / (1520 + 1510 + 1550).
As can be seen from the formula, the indicators of the enterprise’s liquidity ratio characterize the current situation from the perspective of what share of existing debts is closed immediately, through the cumulative use of funds, transfers for transactions from debtors, sales of bonds, etc. It is logical that a result equal to or greater than 0.8 is considered optimal, meaning that upcoming revenues in the near future cover all the company’s obligations.
Recommendations for optimizing the value under consideration, as a rule, come down to taking a set of measures to increase one’s own current assets, as well as attracting borrowed financial resources with a long repayment period. At the same time, it must be taken into account that excessive growth of indicators is a sign of an incorrectly structured capital investment structure, low turnover of commercial products, or a significant increase in customer debt, which increases the risk of non-fulfillment of obligations.
Absolute liquidity ratio
Another evaluation criterion is the ratio of cash and investments to current liabilities. The source of data remains unchanged, but the methodology for determining assets changes again - this time they include exclusively the company’s finances and property assets equal in speed of circulation. That is, we are talking only about that property, the sale of which will take a minimum of time, or is not required at all - due to the possibility of using it as an independent payment instrument.
The calculation procedure looks like this:
- KLA = (money + investments with short periods) / debt load.
- K = (250 + 260) / (610 + 620 + 660).
- K = (1240 + 1250) / (1520 + 1510 + 1550).
Calculation of the absolute liquidity ratios of an enterprise using the formula shows solvency in terms of the size of existing liabilities and the amount of resources that require minimal time expenditure for repayment. A natural indicator is considered to be a result above 0.2. It should be borne in mind that an overestimated value usually indicates incorrect use of high-current assets.
Net working capital
A criterion that determines the financial stability of an organization, representing the difference between total funds and debt obligations. The structure of the latter includes not only loans with a short repayment period, but also accounts payable and economic claims of similar content.
The significance in relation to maintaining the stability of the enterprise’s position is determined quite simply. Excess volume means that the company has both sufficient resources to pay off existing short-term debts and reserves that can be invested in expanding activities or optimizing business processes and equipment in use.
Based on this, NOL = current assets - total current liabilities. When substituting accounting lines:
- K = 290 - 690.
- K = 1200 - 1500.
The optimal option is when the calculated value exceeds the zero mark, but at the same time remains within reasonable limits, excluding the irrational use of financial instruments. Otherwise, there is a high probability of a critical phase of insolvency.
Standard value of the indicator
The optimal value of the coefficient is in the range of 0.2 – 0.5. In other words, at least 20% of the current debt must be secured by cash. The higher the indicator, the greater the guarantee of debt repayment. However, even with its small value, an enterprise can be solvent if it is able to balance and synchronize cash flows in terms of volume and timing.
A significant increase in this indicator is undesirable, since large cash balances indicate their ineffective use. Therefore, money must be in circulation and generate income.
As the ratio increases, the enterprise becomes solvent, and therefore financially stable. When it decreases, the company's financial position worsens. Sometimes a decrease in the indicator may indicate an increase in the efficiency of asset use. This happens when the coefficient value is significantly higher than the standard.
What is liquidity ratio
Briefly, it is an economic indicator calculated using a standard formula and based on balance sheet calculation data. The value obtained as a result of the calculation reflects the ability of a legal entity to satisfy claims on existing debts, using only current working capital.
The assessment takes into account suppliers, investment groups and creditors, and allows us to understand not only the prospects for profit from cooperation with the company, but also the possible risks that may arise if the obligations are refused. Providing comprehensive reporting eliminates the possibility of unfair partnerships and objectively characterizes the current circumstances.
A result within 1.5-2.5 is considered normal. In situations where the value is less than one, the inability of the enterprise to service its own debt is obvious, while if the specified norm threshold is exceeded, one can speak of irrationality in the management of capital, as well as low turnover.
Analysis and assessment of the absolute liquidity ratio
Let's calculate the absolute liquidity ratio of the enterprise in the past (T0) and current (T1) periods, and also analyze its dynamics.
Table 1 – Calculation of the absolute liquidity ratio, thousand rubles.
| Index | T₁ | That | Change | Growth rate, % |
| Cash | 433 | 100 | 333 | 433 |
| Financial investments | 7 | 0 | 7 | X |
| Total current assets | 440 | 100 | 340 | 440 |
| Accounts payable | 7606 | 4765 | 2841 | 160 |
| Borrowed funds | 5776 | 20 | 5756 | 28880 |
| Total current liabilities | 13437 | 4835 | 8602 | 278 |
| Absolute liquidity ratio | 0.03 | 0.02 | 0.01 | 158 |
Analysis of the calculated values of the absolute liquidity ratio showed the following.
In the past and reporting year, the absolute liquidity ratio did not reach the standard value. Despite a slight increase in the indicator in the current period (from 0.02 to 0.03), it still remains at a very low level. This proves the company's inability to pay its obligations immediately.
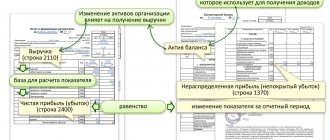
Factor analysis
Having studied the dynamics of the absolute liquidity ratio, it is necessary to evaluate the factors of its change. This is necessary in order to identify the main reasons for changes in the financial position of the enterprise, as well as to justify possible options for management decisions. One of the most widely used methods of factor analysis is the method of chain substitution. This method is universal, as it is used in all types of factor models.
Table 2 – Factor analysis of the absolute liquidity ratio
| Index | Symbol | T1 | T0 | ± | % |
| Absolute liquidity ratio | KAL | 0.03 | 0.02 | 0.01 | 158 |
| Cash, thousand rubles. | DS | 433 | 100 | 333 | 433 |
| Financial investments, thousand rubles. | FV | 7 | 0 | 7 | X |
| Borrowed funds, thousand rubles. | Kr | 5776 | 20 | 5756 | 28880 |
| Accounts payable, thousand rubles. | short circuit | 7661 | 4815 | 2846 | 159 |
| Factor calculations: | |||||
| KAL0 = (DS0+FV0)/(Kr0+KZ0) | 0.02 | ||||
| KALusl1 = (DS1+FV0)/(Kr0+KZ0) | 0.09 | ||||
| KALusl2 = (DS1+FV1)/(Kr0+KZ0) | 0.09 | ||||
| KALusl3 = (DS1+FV1)/(Kr1+KZ0) | 0.04 | ||||
| KAL1 = (DS1+FV1)/(Kr1+KZ1) | 0.03 | ||||
| Change in feces due to factors: | |||||
| cash: KALusl1 - KAL0 | 0.07 | ||||
| financial investments: KALusl2 - KALusl1 | 0.00 | ||||
| short-term loans: KALusl3 - KALusl2 | -0.05 | ||||
| accounts payable: KAL1 - KALusl3 | -0.01 | ||||
| Balance of deviations | 0.01 |
Thus, the absolute liquidity ratio in the reporting year increased by 0.01 points compared to the previous year and amounted to 0.03. This change was the result of the following factors:
- increase in the amount of funds +0.07
- increase in the amount of short-term loans -0.05
- increase in accounts payable -0.01
Total +0.01
The figure below shows the factors for changing the absolute liquidity ratio. Factors in yellow cells are first order factors. The green and orange cells contain second-order factors. They influence changes in first-order factors.
Absolute liquidity ratio for enterprises of the Russian Federation and the telecommunications industry
The value of the absolute liquidity ratio may vary by industry and type of activity. Therefore, the indicator of the analyzed enterprise must be compared with similar average indicators for enterprises in the Russian Federation, the industry and competitors.
The main activity of T2 MOBILE LLC is activities in the field of communications based on wireless technologies. Based on the financial statements[1], we calculate the absolute liquidity ratio of the enterprise for 2013-2018.
[1] https://www.gks.ru/
Table 3 – Calculation of the absolute liquidity ratio of T2 MOBILE LLC, thousand rubles.
| Index | 2013 | 2014 | 2015 | 2016 | 2017 | 2018 |
| Cash | 52 | 4092 | 361240 | 261420 | 1012750 | 339186 |
| Financial investments | 0 | 90410 | 1679738 | 0 | 0 | 44519 |
| Total current assets | 52 | 94502 | 2040978 | 261420 | 1012750 | 383705 |
| Borrowed funds | 0 | 3820188 | 3599088 | 9122134 | 13391017 | 14617288 |
| Accounts payable | 146658 | 3543312 | 36182276 | 30565227 | 22402760 | 31099825 |
| Total current liabilities | 146658 | 7363500 | 39781364 | 39687361 | 35793777 | 45717113 |
| Absolute liquidity ratio | 0.00 | 0.01 | 0.05 | 0.01 | 0.03 | 0.01 |
At the next stage, the obtained coefficients will be compared with similar indicators for Russian enterprises and the industry. Calculations were made on the basis of financial statements data from the database of the Federal State Statistics Service of the Russian Federation.
Table 4 - Dynamics of changes in the absolute liquidity ratio for enterprises of the Russian Federation, the telecommunications industry and T2 MOBILE LLC
| Index | 2013 | 2014 | 2015 | 2016 | 2017 | 2018 |
| All enterprises of the Russian Federation | 0.1 | 0.09 | 0.08 | 0.09 | 0.11 | 0.12 |
| All industry enterprises | 0.16 | 0.14 | 0.13 | 0.15 | 0.17 | 0.18 |
| T2 MOBILE LLC | 0.00 | 0.01 | 0.05 | 0.01 | 0.03 | 0.01 |
As a result of comparing the absolute liquidity ratios of T2 MOBILE LLC, Russian enterprises and the industry, the following was established.
Throughout the analyzed period, the value of the coefficient of T2 MOBILE LLC does not reach the standard value. Moreover, in 2018 it worsened.
The value of the absolute liquidity ratio of T2 MOBILE LLC is significantly worse than the similar indicator of all large enterprises in the industry. The same conclusion can be drawn when comparing the coefficient of T2 MOBILE LLC with the average similar indicator for all enterprises in the Russian Federation.
Comparison with competitors
The closest competitors of T2 MOBILE LLC are PJSC Vympel Communications and PJSC Mobile Telesystems. Let's compare the absolute liquidity ratios of the analyzed enterprise and competitors' enterprises. Calculations were made on the basis of financial statements from the database of the Federal State Statistics Service of the Russian Federation.
Table 5 - Dynamics of changes in the absolute liquidity ratio for T2 MOBILE LLC and its closest competitors
| Index | 2013 | 2014 | 2015 | 2016 | 2017 | 2018 |
| T2 Mobile LLC | 0.00 | 0.01 | 0.05 | 0.01 | 0.03 | 0.01 |
| PJSC Mobile Telesystems | 0.24 | 0.32 | 0.54 | 0.11 | 0.44 | 0.58 |
| PJSC "Vympel Communications" | 1.2 | 0.18 | 0.21 | 0.18 | 0.75 | 0.41 |
As a result of the analysis of the absolute liquidity ratios of T2 MOBILE LLC and competitor enterprises, the following conclusions were made.
The value of the absolute liquidity ratio of T2 MOBILE LLC throughout the analyzed period is lower than similar indicators of competitors. The highest coefficient value in 2022 was at Mobile Telesystems PJSC (0.58 - higher than the standard value). The second place was occupied by PJSC Vympel Communications (0.41 – corresponds to the standard value). T2 MOBILE LLC is in third place in this list (0.01 – below the standard value).
Forecasting the indicator
Analysis of the dynamics of changes in the indicator over several reporting periods allows us to predict its further changes. The figure shows the dynamics of changes in the absolute liquidity ratio and makes a forecast based on linear regression.
The figure shows that an upward trend is emerging. Moreover, the value of the coefficient throughout the analyzed period is much lower than the standard value.
Grouping by balance
Let's move on to consider the sorting of assets and liabilities reflected in the accounting structure. In this case, the first category is arranged in descending order, while the second is based on the urgency of satisfying the corresponding debt.
| Assets | Liabilities | ||||
| ABB No. 1 | Highly liquid | Money and investments with short terms | PBB No. 1 | Priority | Current accounts payable |
| ABB No. 2 | With fast implementation speed | Urgent debts of debtors | PBB No. 2 | Average | Loans, reserves, certain types |
| ABB No. 3 | With slow implementation speed | The rest are negotiable | PBB No. 3 | Long | Obligations of the fourth section |
| ABB No. 4 | Hard to implement | All non-current resources | PBB No. 4 | Permanent | Own funds |
Thus, based on the data obtained as a result of the analysis of balance sheet indicators, the financial position can be determined by comparing the indicated groups. The predominance of the first value over the second indicates the possibility of debt closure. So, for example, the following ratios are characteristic of absolute liquidity:
- ABB No. 1 > PBB No. 1 - when selling highly liquid assets, the enterprise will be able to pay off priority obligations.
- ABB No. 2 > PBB No. 2 - circulation will allow you to repay debts with an average repayment period.
- ABB No. 3 > PBB No. 3 - money from the sale of objects that are circulated at a low rate covers claims whose return period exceeds one year.
- ABB No. 4 < PBB No. 4 - the total assessment of the organization’s hard-to-sell assets is less than the value of its own capital.
Ways to increase the level of absolute liquidity
Factors and ways to optimize the absolute liquidity ratio are:
- growth of long-term sources of financing
- changing the capital structure in favor of sustainable liabilities: long-term liabilities and equity
- reduction in the level of non-current assets, inventories, accounts receivable and short-term liabilities
- increasing the efficiency of the enterprise
- reinvestment of profits
- transfer of payments from the last day of the reporting period to the first day of the next
- control over cash balances in the cash register and bank accounts of the enterprise
Notes and adjustments
Cash is a medium that all participants in the financial process agree to exchange when making financial transactions. In order for cash to be classified as a current asset, there must be no restrictions on its storage or use. This situation is possible, for example, in the event of a court decision to seize funds. If there are such restrictions, then it is necessary to adjust the indicator of cash and cash equivalents, which is used in calculating the indicator.
Companies often display restricted cash as cash and equivalents on the balance sheet. In such a case, information about the restrictions can be found in the notes to the financial statements. In addition to reducing cash and cash equivalents by the amount of the restricted portion, you must also adjust the value of current liabilities and subtract those associated with the restriction.
Value above/below normal
As mentioned earlier, the foreign absolute liquidity standard is 0.2, but in Russian analytical practice the upper limit of this value has been identified, which is equal to 0.5. When the value is below the norm of 20%, it is considered that the increase in short-term loans is not proportional to the increase in current assets. The situation may be associated with the emergence of new sources of additional income for the company, which resulted in an increase in free cash flows in the accounts.
An increase in the absolute liquidity ratio may be associated with a decrease in accounts receivable due to an agreement with counterparties on advance payment for supplies, as well as with optimization of inventory management.
In general, in practice, consideration of liquidity ratios should be accompanied by their totality. Variation in values can be due to all sorts of reasons that are theoretically impossible to cover.
The difference between absolute liquidity and current and urgent liquidity
If the absolute liquidity ratio shows immediate solvency, then critical and current liquidity data reflect the company’s ability to cover obligations in the medium and long term. Although all three coefficients are calculated in financial analysis, the resulting values are of interest to different groups of subjects. Thus, the quick liquidity ratio is important for creditors and banks to assess timely solvency.
The current liquidity indicator is used by investors to confirm the fulfillment of current obligations on time. And the absolute liquidity ratio is attractive for suppliers with short credit terms, because its value expresses the ability to immediately repay current short-term obligations.
The main difference between all three indicators is the composition of liquid funds involved in repaying the company’s debt.
Types of liquidity
Assessing the solvency of a business entity consists of calculating and analyzing liquidity ratios. The current indicator demonstrates how many monetary units from existing assets correspond to one ruble of short-term debt. That is, the higher the absolute value of current assets, in comparison with short-term liabilities, the more stable the financial condition of the company. The quick liquidity ratio indicates the ability of an enterprise to immediately repay its debt using cash, investments and debts due to a given src=»https://businessman.ru/static/img/a/33842/214990/18777.jpg» class= "aligncenter" width="692″ height="360″[/img]
And the third absolute liquidity ratio shows the ability of an enterprise to cover current obligations exclusively with the funds available at a particular point in time at the disposal of an economic entity.
Conclusions about what a change in indicator means
If the indicator is higher than normal
Perhaps the organization has too much cash that is not performing and may depreciate over time.
If the indicator is below normal
Perhaps the organization does not have enough cash to make payments on short-term obligations.
If the indicator increases
Usually a positive factor
If the indicator decreases
Usually a negative factor
Notes
The indicator in the article is considered from the point of view not of accounting, but of financial management. Therefore, sometimes it can be defined differently. It depends on the author's approach.
In most cases, universities accept any definition option, since deviations according to different approaches and formulas are usually within a maximum of a few percent.
The indicator is considered in the main free online financial analysis service and some other services
If you need conclusions after calculating the indicators, please look at this article: conclusions from financial analysis
If you see any inaccuracy or typo, please also indicate this in the comment. I try to write as simply as possible, but if something is still not clear, questions and clarifications can be written in the comments to any article on the site.
Best regards, Alexander Krylov,
The financial analysis:
- Balance sheet liability The balance sheet liability is the second part of the balance sheet. It contains a list of those financial resources that were used to acquire property, that is, assets that...
- V. CURRENT LIABILITIES Section V. Current liabilities is the fifth section of the balance sheet. At the same time, it is also the third section of the liability side of the balance sheet, which shows the sources of financing for the property. AND…
- I. NON-CURRENT ASSETS Non-current assets are property used in the activities of an enterprise for more than a year. Its value is transferred in parts to the cost of finished products. A sign of assets is the ability to generate income for the organization.…
- Balance sheet asset A balance sheet asset is a part of the balance sheet containing data on the assets of the enterprise, that is, on its property. The balance sheet asset reflects property, property rights and cash...
- II. CURRENT ASSETS Current assets are property used in the activities of an enterprise for less than a year or used in one production cycle, which also does not exceed one year. Its entire cost...
- Horizontal and vertical analysis of the balance sheet and income statement (profit and loss) Good afternoon, my dear reader. In this article we will consider such a topic as horizontal and vertical analysis of the balance sheet and financial results statement (income and...
- Absolute economic indicators of an enterprise's activity Absolute economic indicators of an enterprise's activity are indicators that allow us to judge several things: The size of the enterprise and the scale of its activities The level of income and expenses...
- IV. LONG-TERM LIABILITIES Section IV. Long-term liabilities are the fourth section of the balance sheet. At the same time, it is also the second section of the liability side of the balance sheet, which shows the sources of financing for the property. AND…
- III. CAPITAL AND RESERVES Section III Capital and Reserves is the third section of the balance sheet. But what is more important is the first section of financial sources, that is, the liability side of the balance sheet. By this he...
- Key performance indicators of an enterprise Key performance indicators of an enterprise are indicators that allow us to judge several things: The size of the enterprise and the scale of its activities The level of income and expenses About ...