Definition
A3 Slowly selling assets are current assets with a low level of liquidity.
If - these are assets that can be converted into monetary form immediately (or it is already money), and - assets that will be transferred into this form mainly within 3 months, then the assets of the third group can be converted into monetary form in longer period (up to a year).
And this category thus includes current assets minus cash, cash equivalents, short-term financial investments and accounts receivable.
Well, or, what is the same thing, all these low-liquid assets are added up: inventories, VAT on purchased assets, and other current assets.
In some sources, other current assets are classified as group A2, which in my opinion is incorrect, since other current assets have less liquidity than receivables, which make up group A2.
Analysis of liquidity of the enterprise balance sheet
Balance sheet liquidity is the degree to which the enterprise's liabilities are covered by assets, the period of conversion of which into cash corresponds to the period of repayment of liabilities. The solvency of the enterprise depends on the degree of balance sheet liquidity. The main sign of liquidity is the formal excess of the value of current assets over short-term liabilities. And the greater this excess, the more favorable the financial condition of the enterprise in terms of liquidity.
The relevance of determining balance sheet liquidity acquires particular importance in conditions of economic instability, as well as during the liquidation of an enterprise due to its bankruptcy. Here the question arises: does the enterprise have enough funds to cover its debt. The same problem arises when it is necessary to determine whether the enterprise has enough funds to pay creditors, i.e. the ability to liquidate (repay) debt with available funds.
In this case, speaking of liquidity, we mean the presence of working capital at the enterprise in an amount theoretically sufficient to repay short-term obligations.
To analyze the liquidity of an enterprise's balance sheet, asset items are grouped according to the degree of liquidity - from the most quickly converted into cash to the least. Liabilities are grouped according to the urgency of payment of obligations. A typical grouping is shown in the table below:
Table. Grouping balance sheet assets and liabilities for liquidity analysis
| Assets | Liabilities | ||||||
| Group name | Designation | Compound | Group name | Designation | Compound | ||
| Balance until 2011 | Balance since 2011 | Balance until 2011 | Balance since 2011 | ||||
| Most liquid assets | A1 | pp. 260 250 | page 1250 1240 | Most urgent obligations | P1 | pp. 620 630 | page 1520 |
| Quickly marketable assets | A2 | pp. 240 270 | page 1230 | Short-term liabilities | P2 | pp. 610 650 660 | page 1510 1540 1550 |
| Slow moving assets | A3 | pp. 210 220 – 216 | pp. 1210 1220 1260 — 12605 | Long-term liabilities | P3 | page 590 | page 1400 |
| Hard to sell assets | A4 | pp. 190 230 | page 1100 | Permanent liabilities | P4 | pp. 490 640 – 216 | pp. 1300 1530 – 12605 |
| Total assets | VA | Total liabilities | VR | ||||
HELL. Sheremet points out the need to deduct expenses not covered by funds and targeted financing, and the amount of settlements with employees for loans they received. Expenses not covered by funds and targeted financing, as well as the excess of settlements with employees on loans received by them over the amount of bank loans, due to the issuance of loans to employees at the expense of special funds of the organization, are reduced when immobilization is subtracted from the value of sources of own funds. If, during the internal analysis, immobilization is detected under the items of other debtors and other assets, the total of quickly realizable assets is also reduced by its amount. (A.D. Sheremet. Comprehensive analysis of economic activity).
To assess balance sheet liquidity taking into account the time factor, it is necessary to compare each asset group with the corresponding liability group.
1) If the inequality A1 > P1 is true, then this indicates the solvency of the organization at the time of drawing up the balance sheet. The organization has enough absolutely and most liquid assets to cover its most urgent obligations.
2) If the inequality A2 > P2 is feasible, then quickly realizable assets exceed short-term liabilities and the organization can be solvent in the near future, taking into account timely settlements with creditors and receipt of funds from the sale of products on credit.
3) If the inequality A3 > P3 is feasible, then in the future, with timely receipt of funds from sales and payments, the organization can be solvent for a period equal to the average duration of one turnover of working capital after the balance sheet date.
Fulfillment of the first three conditions automatically leads to the fulfillment of the condition: A4<=П4
Fulfillment of this condition indicates compliance with the minimum condition for the financial stability of the organization, the availability of its own working capital.
Based on a comparison of groups of assets with the corresponding groups of liabilities, a judgment is made about the liquidity of the enterprise's balance sheet.
A comparison of liquid funds and liabilities allows us to calculate the following indicators:
- current liquidity, which indicates the solvency () or insolvency (-) of the organization for the period of time closest to the moment under consideration: A1 A2=>P1 P2 ; A4<=P4
- prospective liquidity is a forecast of solvency based on a comparison of future receipts and payments: A3>=P3 ; A4<=P4
- insufficient level of prospective liquidity: A4<=P4
- balance is not liquid: A4=>P4
However, it should be noted that the analysis of balance sheet liquidity carried out according to the above scheme is approximate; a more detailed analysis of solvency using financial ratios is performed.
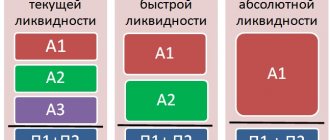
1. The current ratio shows whether the enterprise has enough funds that it can use to pay off its short-term obligations during the year. This is the main indicator of the solvency of an enterprise. The current liquidity ratio is determined by the formula:
K = (A1 A2 A3) / (P1 P2)
In world practice, the value of this coefficient should be in the range of 1-2. Naturally, there are circumstances in which the value of this indicator may be greater, however, if the current liquidity ratio is more than 2-3, this, as a rule, indicates an irrational use of the enterprise’s funds. A value of the current liquidity ratio below one indicates the insolvency of the enterprise.
2. Quick liquidity ratio , or “critical assessment” ratio, shows how much the liquid assets of an enterprise cover its short-term debt. The quick liquidity ratio is determined by the formula:
K = (A1 A2) / (P1 P2)
Liquid assets of an enterprise include all current assets of the enterprise, with the exception of inventory. This indicator determines what proportion of accounts payable can be repaid using the most liquid assets, i.e. it shows what part of the enterprise’s short-term liabilities can be immediately repaid using funds in various accounts, short-term securities, as well as settlement proceeds. The recommended value of this indicator is from 0.7-0.8 to 1.5.
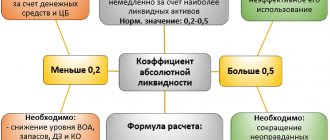
3. The absolute liquidity ratio shows what part of the accounts payable the company can pay off immediately. The absolute liquidity ratio is calculated using the formula:
K = A1 / (P1 P2)
Shows what portion of short-term liabilities can be immediately repaid using funds in various accounts, short-term securities, as well as proceeds from accounts receivable. The value of this indicator should not fall below 0.2.
4. For a comprehensive assessment of the liquidity of the balance sheet as a whole, it is recommended to use the general indicator of liquidity of the balance sheet of the enterprise , which shows the ratio of the sum of all liquid funds of the enterprise to the sum of all payment obligations (short-term, long-term, medium-term), provided that various groups of liquid funds and payment obligations are included in specified amounts with certain weighting coefficients that take into account their significance in terms of the timing of receipt of funds and repayment of obligations. The overall balance sheet liquidity indicator is determined by the formula:
K = (A1 0.5*A2 0.3*A3) / (P1 0.5*P2 0.3*P3)
Evaluates changes in the financial situation of the company from the point of view of liquidity. This indicator is used when choosing a reliable partner from a variety of potential partners based on financial statements. The value of this coefficient must be greater than or equal to 1.
5. The equity ratio shows how sufficient the enterprise’s own working capital is, which is necessary for its financial stability. It is defined:
K = (P4 - A4) / (A1 A2 A3)
The value of this coefficient must be greater than or equal to 0.1.
6. The coefficient of maneuverability of functional capital shows what part of the operating capital is contained in reserves. If this indicator decreases, then this is a positive fact. It is determined from the relation:
K = A3 / [(A1 A2 A3) - (P1 P2)]
During the analysis of balance sheet liquidity, each of the considered liquidity ratios is calculated at the beginning and end of the reporting period. If the actual value of the coefficient does not correspond to the normal limit, then it can be estimated by its dynamics (increase or decrease in value).
It should be noted that in most cases, achieving high liquidity is at odds with achieving higher profitability. The most rational policy is to ensure the optimal combination of liquidity and profitability of the enterprise.
Along with the above indicators, indicators based on cash flows can be used to assess the state of liquidity:
- net cash flow (NCF - Net Cash Flow);
- cash flow from operating activities (CFO - Cash Flow from Operations);
- cash flow from operating activities adjusted for changes in working capital (OCF - Operating Cash Flow);
- cash flow from operating activities, adjusted for changes in working capital and satisfaction of investment needs (OCFI - Operating Cash Flow after Investments);
- free cash flow (FCF - Free Cash Flow).
At the same time, regardless of the stage of the life cycle at which the enterprise is located, management is forced to solve the problem of determining the optimal level of liquidity, since, on the one hand, insufficient liquidity of assets can lead to both insolvency and possible bankruptcy, and on the other hand, excess liquidity may lead to decreased profitability. Because of this, modern practice requires the emergence of increasingly advanced procedures for analyzing and diagnosing the state of liquidity.
Hello Guest! Offer from "Clerk"
Online professional retraining “Accountant on the simplified tax system” with a diploma for 250 academic hours . Learn everything new to avoid mistakes. Online training for 2 months, the stream starts on March 1.
Sign up
Conclusions about what a change in indicator means
If the indicator is higher than normal
Not standardized
If the indicator is below normal
Not standardized
If the indicator increases
Usually a positive factor
If the indicator decreases
Usually a negative factor
Notes
The indicator in the article is considered from the point of view not of accounting, but of financial management. Therefore, sometimes it can be defined differently. It depends on the author's approach.
In most cases, universities accept any definition option, since deviations according to different approaches and formulas are usually within a maximum of a few percent.
The indicator is considered in the main free online financial analysis service and some other services
If you need conclusions after calculating the indicators, please look at this article: conclusions from financial analysis
If you see any inaccuracy or typo, please also indicate this in the comment. I try to write as simply as possible, but if something is still not clear, questions and clarifications can be written in the comments to any article on the site.
Best regards, Alexander Krylov,
The financial analysis:
- II. CURRENT ASSETS Current assets are property used in the activities of an enterprise for less than a year or used in one production cycle, which also does not exceed one year. Its entire cost...
- Balance sheet asset A balance sheet asset is a part of the balance sheet containing data on the assets of the enterprise, that is, on its property. The balance sheet asset reflects property, property rights and cash...
- I. NON-CURRENT ASSETS Non-current assets are property used in the activities of an enterprise for more than a year. Its value is transferred in parts to the cost of finished products. A sign of assets is the ability to generate income for the organization.…
- IV. LONG-TERM LIABILITIES Section IV. Long-term liabilities are the fourth section of the balance sheet. At the same time, it is also the second section of the liability side of the balance sheet, which shows the sources of financing for the property. AND…
- III. CAPITAL AND RESERVES Section III Capital and Reserves is the third section of the balance sheet. But what is more important is the first section of financial sources, that is, the liability side of the balance sheet. By this he...
- Balance sheet liability The balance sheet liability is the second part of the balance sheet. It contains a list of those financial resources that were used to acquire property, that is, assets that...
- V. CURRENT LIABILITIES Section V. Current liabilities is the fifth section of the balance sheet. At the same time, it is also the third section of the liability side of the balance sheet, which shows the sources of financing for the property. AND…
- Horizontal and vertical analysis of the balance sheet and income statement (profit and loss) Good afternoon, my dear reader. In this article we will consider such a topic as horizontal and vertical analysis of the balance sheet and financial results statement (income and...
- Absolute economic indicators of an enterprise's activity Absolute economic indicators of an enterprise's activity are indicators that allow us to judge several things: The size of the enterprise and the scale of its activities The level of income and expenses...
- Key performance indicators of an enterprise Key performance indicators of an enterprise are indicators that allow us to judge several things: The size of the enterprise and the scale of its activities The level of income and expenses About ...