What is this
The above concept denotes the amount of a person’s monthly income that he needs to ensure a standard of living that is minimally acceptable for a developed society. According to existing statistical rules and legislation, mathematically this value is expressed as the sum of two parameters:
- Estimates of the amount of money required to purchase a consumer basket.
- The amount a person spends on taxes and fees.
Along with the fact that Rosstat calculates average indicators for the Russian Federation as a whole, statistics for each region are determined separately. It should be recalled that the parameters of the consumer basket are determined by addition:
- The cost of purchasing the minimum amount of food necessary for normal human existence.
- The cost of purchasing urgently needed non-food goods, as well as services.
Calculation method
It is legally established that this indicator for people of working age is calculated by adding the cost of the consumer basket for an adult and his expenses for taxes and fees. When calculating this parameter for children and pensioners, tax payments are excluded. The size of the consumer basket for each of these categories is different.
Statisticians determine separately the values for the following groups:
- able-bodied.
- Children.
- Pensioners.
- The average “soul” for the region and the country as a whole.
The average subsistence minimum per capita is calculated by multiplying the previously obtained values of the above statistical indicator for each of the significant socio-demographic groups by the total share of representatives of this group in the population of the Russian Federation and summing up the results obtained.
The quarterly value is calculated as the sum of previously determined income for the corresponding category for 3 months, divided by 3.
How to calculate the cost of living?
Most government support measures are carried out in relation to the needy segments of the population. The principle of need is determined based on the minimum subsistence level for each family member. The following features are taken into account:
- each socio-demographic group has its own subsistence level, therefore the family should initially be divided into such groups and the number of people determined for each of them;
- PM values are determined according to the regional or federal table, depending on the level of social support applied to the family.
The average cost of living for a family is calculated using the following formula:
(PM1 × N1 + PM2 × N2 + PM3 × N3) / (N1 + N2 + N3), where
- PM1, PM2, PM3 - the cost of living for each group of the population, which includes family members;
- N1, N2, N3 – the number of people in each population group.
For example, let’s take a family living together with the following composition: a mother and father of working age, two children under 15 years of age and a retired grandmother. Let's calculate the average monthly income per each family member to understand whether we can classify the family as low-income to provide, for example, benefits for housing and communal services.
Using the example of the PM established in the Perm region for 2022, we apply the following values:
- for able-bodied citizens – 11,338 rubles,
- for pensioners – 8703 rubles,
- for children – 10,703 rubles.
Accordingly, for each member of the specified family the PM will be:
(11338 × 2 + 10703 × 2 + 8703 × 1) / 5 = 10557 rubles.
This indicator is compared with the average per capita value for the region (in our example - 10,556 rubles) and a conclusion is drawn whether the family is considered to be in need.
The pensioner's subsistence level is taken into account when establishing and paying a pension. If, to assign a pension according to the given parameters, a citizen has formed an amount less than the minimum monthly wage, he will be paid a federal social supplement.
The amount of the surcharge is the difference between the pensioner’s minimum wage established on the calculation date and the accrued pension. Thus, the pension benefit is brought to the subsistence level - the minimum necessary for food, purchasing basic necessities and paying for a minimum range of services (housing and communal services, hairdresser, etc.).
Consumer basket
Since the size of the consumer basket directly affects the size of the subsistence level, a little should be said about it and the methodology for calculating it. It represents the addition of the cost:
- The range of food that a person needs to maintain physiological health and ensure his normal functioning.
- Non-food goods and services that we cannot do without in our country.
The minimum set of necessary food has been scientifically calculated for each of the main socio-demographic categories of the population of the Russian Federation. Now it looks like this.
At the same time, it is legally determined that the cost of non-food products and especially important services is 50% of the cost of the food basket.
Official data
Once every few months, Rosstat updates official data on the average cost of living in our country on its website. According to this information, its per capita value in the fourth quarter of 2022 was 10,609.
By region, these indicators differ very, very strongly. For example, this figure per capita in the Belgorod region in the first quarter of 2022 was only 9,395.
Not far from the Belgorod region is the Republic of Mordovia, where these data for the same period of time amounted to 8872. In Moscow it was determined at 19797. The highest values are in the regions of the Far East and the Far North. In the Republic of Sakha (Yakutia), the data for the first quarter of 2022 was 16938. In the Magadan region - 19528, and in the Kamchatka Territory 20527. The leader in this parameter is the Chukotka Autonomous Okrug.
In this subject of the Federation, the cost of living per capita for the first three months of 2022 was 21,997 rubles.
It is interesting to compare these data with the “average” regions. For example, in the Kabardino-Balkarian Republic, the per capita indicator for the first three months of 2022 is set at 10,497.
In the Ulyanovsk region, statistics counted 10,159 rubles, which is enough to ensure that the average “soul” does not cross the poverty level in the first quarter of 2022. According to information from the Amur region, in the first quarter of 2022 the parameter amounted to 11,172 rubles.
Table of the cost of living in Russia by quarter
| Period | Amount in rubles/month. | Official document | |||
| Per capita | For the working population | For pensioners | For children | ||
| From 01/01/2022 | 11950 | 13026 | 10277 | 11592 | Decree of the Government of the Russian Federation No. 1070 of June 30, 2021 |
| 2021 | 11653 | 12702 | 10022 | 11303 | No. 2406 from 12/31/2020 |
| IV quarter 2020 | 11329 | 12273 | 9348 | 11140 | No. 542n dated March 16, 2021 |
| III quarter 2020 | 11606 | 12542 | 9519 | 11580 | No. 987n dated 12/31/2020 |
| II quarter 2020 | 11468 | 12392 | 9422 | 11423 | No. 542n dated 08/28/2020 |
| I quarter 2020 | 10843 | 11731 | 8944 | 10721 | No. 372n dated June 25, 2020 |
| IV quarter 2019 | 10609 | 11510 | 8788 | 10383 | No. 72n dated 02/20/2020 |
| III quarter 2019 | 11012 | 11942 | 9090 | 10838 | No. 738n dated November 25, 2019 |
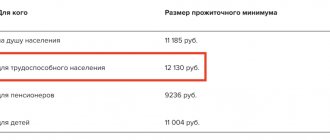
| II quarter 2019 | 11185 | 12130 | 9236 | 11004 | No. 561n dated 08/09/2019 |
| I quarter 2019 | 10753 | 11653 | 8894 | 10585 | No. 461n dated 07/02/2019 |
| IV quarter 2018 | 10213 | 11069 | 8464 | 9950 | No. 102n dated 02/20/2019 |
| III quarter 2018 | 10451 | 11310 | 8615 | 10302 | No. 695n dated 11/12/2018 |
| II quarter 2018 | 10444 | 11280 | 8583 | 10390 | No. 550n dated 08/24/2018 |
| I quarter 2018 | 10038 | 10842 | 8269 | 9959 | No. 410n dated June 25, 2018 |
| IV quarter 2017 | 9786 | 10573 | 8078 | 9603 | No. 232n dated 04/13/2018 |
| III quarter 2017 | 10328 | 11160 | 8496 | 10181 | No. 1490 from 08.12.2017 |
| II quarter 2017 | 10329 | 11163 | 8506 | 10160 | No. 1119 from 09/19/2017 |
| I quarter 2017 | 9909 | 10701 | 8178 | 9756 | No. 730 from 06/20/2017 |
| IV quarter 2016 | 9691 | 10466 | 8000 | 9434 | No. 352 dated March 30, 2017 |
| III quarter 2016 | 9889 | 10678 | 8136 | 9668 | No. 1275 dated 12/01/2016 |
| II quarter 2016 | 9956 | 10722 | 8163 | 9861 | No. 882 of 09/06/2016 |
| I quarter 2016 | 9776 | 10524 | 8025 | 9677 | No. 511 from 06/09/2016 |
| IV quarter 2015 | 9452 | 10187 | 7781 | 9197 | No. 178 from 03/10/2016 |
| III quarter 2015 | 9673 | 10436 | 7951 | 9396 | No. 1291 of November 30, 2015 |
| II quarter 2015 | 10017 | 10792 | 8210 | 9806 | No. 902 from 08/28/2015 |
| I quarter 2015 | 9662 | 10404 | 7916 | 9489 | No. 545 of 06/04/2015 |
| IV quarter 2014 | 8234 | 8885 | 6785 | 7899 | No. 260 from 03/21/2015 |
| III quarter 2014 | 8086 | 8731 | 6656 | 7738 | No. 1321 from 05.12.2014 |
| II quarter 2014 | 8192 | 8834 | 6717 | 7920 | No. 905 of 09/06/2014 |
| I quarter 2014 | 7688 | 8283 | 6308 | 7452 | No. 586 of June 26, 2014 |
Attention! From January 1, 2022, the model for establishing the cost of living will change. Now, in the Russian Federation as a whole, it will be installed annually. This agreement was reached at a joint meeting of the State Council and the Council for Strategic Development and National Projects.
Distribution
However, let us recall that the indicator is calculated not only for the average resident of Russia. It is also considered separately for:
- Working population.
- Pensioners.
- Children's population.
It is worth considering in more detail the indicators for each of these categories.
Working population
On average for the Russian Federation for the 4th quarter of 2022, this figure, according to Rosstat, was 10,609. The distribution picture by region is also very interesting.
As in determining the general cost of living, the leaders are the Far East and the Far North. The first place is occupied by Chukotka, where this figure is 22,894 rubles. for the first three months of 2022. In the Kamchatka Territory and the Magadan Region it was determined as 21426 and 20571, respectively. In Moscow it is 19,351 rubles.
Against this background, St. Petersburg with an amount of only 12,118 rubles. looks pretty dull. And the outsiders, as in the first case, will be the Belgorod region. There, statistics counted only 9,366 required by the adult population to maintain a minimum acceptable standard of living.
Pensioners
According to federal statistics, the average Russian pensioner needs only 8,788 rubles in order not to be officially poor in the 4th quarter of 2022. At the same time, Chukotka statisticians determined the necessary minimum for life for people of the older generation at 17147, Kamchatka statisticians at 16228, Magadan statisticians at 15419, and Moscow statisticians at 12005 for October-December 2022. At the same time, Belgorod pensioners, according to official data, could be content with 7257 in order not to feel poor.
Children
Interesting information on children's subsistence level. In September - December 2022, it was determined for the Russian Federation at 10,383 rubles. Moreover, in the most remote regions it exceeds the figures calculated by statistics for working-age citizens, amounting to 23,066 for Chukotka, 21,842 for Kamchatka and 20,887 for Magadan for the same period in 2022.
This fact is probably associated with the higher price of fruits and vegetables, of which children especially need a lot for growth and development. In Moscow, the cost of living for children is already inferior to that of adults, amounting to 14,647 for the same period. And according to statisticians in the Belgorod region, only 8,474 are spent on local children to maintain their proper standard of living.
Living wage by regions of the Russian Federation
Today, in a number of cases, for example, when receiving child benefits, you need to know the size of the subsistence minimum established in the region. We have compiled tables in which residents of each constituent entity of Russia can find PM indicators as of the second quarter of 2019 and the first quarter of 2022.
Our tables present the general cost of living for the entire population, as well as indicators calculated for certain socio-demographic groups. For example, there is a living wage for a child, a pensioner or an able-bodied citizen. All data is obtained from official sources. As necessary, the tables will be supplemented with information on new periods.
Living wage established in the regions for the second quarter of 2022 (Rosstat data)
| Region | General PM for the population | Children | Pensioners | Working population |
| Central District | ||||
| Belgorod region | 9 328 | 9 084 | 7 767 | 10 039 |
| Bryansk region | 10 905 | 10 606 | 9 058 | 11 721 |
| Vladimir region | 10 768 | 10 780 | 9 062 | 11 746 |
| Voronezh region | 9 410 | 9 190 | 7 841 | 10 140 |
| Ivanovo region | 10 544 | 10 327 | 8 842 | 11 513 |
| Kaluga region | 11 060 | 10 839 | 9 213 | 11 917 |
| Kostroma region | 10 612 | 10 458 | 8 900 | 11 569 |
| Kursk region | 10 162 | 10 107 | 8 447 | 10 927 |
| Lipetsk region | 9 726 | 9 840 | 8 152 | 10 515 |
| Moscow region | 13 115 | 12 688 | 9 848 | 14 547 |
| Oryol Region | 10 362 | 10 316 | 8 606 | 11 124 |
| Ryazan Oblast | 10 279 | 10 154 | 8 552 | 11 125 |
| Smolensk region | 11 232 | 10 898 | 9 330 | 12 088 |
| Tambov Region | 9 641 | 9 490 | 8 120 | 10 524 |
| Tver region | 10 980 | 11 399 | 9 081 | 11 891 |
| Tula region | 10 621 | 10 427 | 9 131 | 11 381 |
| Yaroslavl region | 10 573 | 10 571 | 8 611 | 11 631 |
| Moscow | 17 679 | 15 225 | 12 487 | 20 195 |
| Northwestern District | ||||
| Republic of Karelia | 14 019 | 13 167 | 11 742 | 15 267 |
| Komi Republic | 13 791 | 13 691 | 11 366 | 14 868 |
| Nenets Autonomous Okrug | 20 063 | 21 112 | 16 416 | 21 049 |
| Arhangelsk region | 13 110 | 12 774 | 10 934 | 14 294 |
| Vologda Region | 11 391 | 11 171 | 9 485 | 12 398 |
| Kaliningrad region | 11 590 | 11 005 | 9 536 | 12 459 |
| Leningrad region | 10 759 | 10 379 | 9 160 | 11 646 |
| Murmansk region | 17 149 | 17 193 | 14 257 | 17 841 |
| Novgorod region | 11 162 | 10 994 | 9 284 | 12 130 |
| Pskov region | 11 313 | 11 057 | 9 368 | 12 276 |
| Saint Petersburg | 11 465 | 11 176 | 9 304 | 12 584 |
| Southern District | ||||
| Republic of Adygea | 9 474 | 9 599 | 7 787 | 10 103 |
| Republic of Kalmykia | 10 119 | 10 211 | 8 139 | 10 592 |
| Republic of Crimea | 10 748 | 11 225 | 8 843 | 11 512 |
| Krasnodar region | 11 107 | 10 639 | 9 159 | 12 030 |
| Astrakhan region | 10 571 | 11 256 | 8 855 | 11 067 |
| Volgograd region | 10 048 | 10 123 | 8 179 | 10 794 |
| Rostov region | 10 673 | 11 099 | 8 644 | 11 371 |
| Sevastopol | 11 538 | 12 094 | 9 514 | 12 381 |
| North Caucasus District | ||||
| The Republic of Dagestan | 10 043 | 10 119 | 7 956 | 10 363 |
| The Republic of Ingushetia | 10 461 | 10 246 | 7 899 | 10 226 |
| Kabardino-Balkarian Republic | 12 431 | 13 707 | 9 565 | 12 834 |
| Karachay-Cherkess Republic | 10 220 | 10 402 | 8 268 | 10 798 |
| Republic of North Ossetia-Alania | 9 860 | 10 087 | 7 986 | 10 433 |
| Chechen Republic | 10 997 | 10 811 | 8 976 | 11 350 |
| Stavropol region | 9 550 | 9 843 | 7 810 | 10 222 |
| Privolzhsky district | ||||
| Republic of Bashkortostan | 9 804 | 9 789 | 7 998 | 10 434 |
| Mari El Republic | 9 830 | 10 066 | 8 070 | 10 498 |
| The Republic of Mordovia | 9 181 | 9 442 | 7 592 | 9 914 |
| Republic of Tatarstan | 9 450 | 9 373 | 7 742 | 10 085 |
| Udmurt republic | 9 992 | 9 964 | 8 148 | 10 608 |
| Chuvash Republic | 9 538 | 9 541 | 7 785 | 10 134 |
| Perm region | 10 556 | 10 703 | 8 703 | 11 338 |
| Kirov region | 10 330 | 10 461 | 8 453 | 11 054 |
| Nizhny Novgorod Region | 10 456 | 10 658 | 8 637 | 11 248 |
| Orenburg region | 9 585 | 9 900 | 7 951 | 10 221 |
| Penza region | 9 544 | 9 817 | 7 929 | 10 341 |
| Samara Region | 10 814 | 10 714 | 8 645 | 11 969 |
| Saratov region | 9 521 | 9 708 | 7 893 | 10 276 |
| Ulyanovsk region | 10 343 | 10 482 | 8 510 | 11 110 |
| Ural district | ||||
| Kurgan region | 10 222 | 10 616 | 8 507 | 10 928 |
| Sverdlovsk region | 11 019 | 11 514 | 9 066 | 11 763 |
| Khanty-Mansiysk Autonomous Okrug | 15 337 | 15 164 | 12 617 | 16 568 |
| Yamalo-Nenets Autonomous Okrug | 16 926 | 16 700 | 13 365 | 17 707 |
| Tyumen region | 11 449 | 11 632 | 9 204 | 12 069 |
| Chelyabinsk region | 10 336 | 10 661 | 8 583 | 11 083 |
| Siberian district | ||||
| Altai Republic | 10 162 | 10 259 | 8 527 | 10 468 |
| Tyva Republic | 10 778 | 11 322 | 8 536 | 11 125 |
| The Republic of Khakassia | 11 139 | 11 705 | 8 957 | 11 752 |
| Altai region | 10 194 | 10 203 | 8 818 | 10 837 |
| Krasnoyarsk region | 12 682 | 13 192 | 9 957 | 13 425 |
| Irkutsk region | 11 576 | 11 959 | 9 389 | 12 325 |
| Kemerovo region | 10 389 | 10 778 | 8 405 | 11 011 |
| Novosibirsk region | 11 738 | 12 037 | 9 440 | 12 486 |
| Omsk region | 10 247 | 10 437 | 8 271 | 10 864 |
| Tomsk region | 11 694 | 12 177 | 9 470 | 12 437 |
| Far Eastern District | ||||
| The Republic of Buryatia | 11 549 | 12 065 | 9 155 | 12 000 |
| Transbaikal region | 12 283 | 12 842 | 9 729 | 12 798 |
| The Republic of Sakha (Yakutia) | 17 126 | 17 660 | 13 792 | 18 161 |
| Kamchatka Krai | 20 481 | 22 099 | 16 399 | 21 660 |
| Primorsky Krai | 13 189 | 14 442 | 10 628 | 13 958 |
| Khabarovsk region | 14 369 | 15 181 | 11 594 | 15 260 |
| Amur region | 12 235 | 12 727 | 9 936 | 13 009 |
| Magadan Region | 19 755 | 21 052 | 15 624 | 20 824 |
| Sakhalin region | 14 844 | 16 109 | 11 923 | 15 807 |
| Jewish Autonomous Region | 14 342 | 14 870 | 11 630 | 15 254 |
| Chukotka Autonomous Okrug | 22 474 | 23 272 | 17 347 | 23 082 |
Why did we stop at the second quarter of 2022? Today, a number of payments intended for families with children are related to the subsistence level established for the second quarter of the year, which was before applying for benefits. In other words, in the current year it is necessary to take into account the indicators of last year.
For example, let's remember payments for children over 3 and under 8 years old. If the average income of each family member is less than the subsistence level established for the 2nd quarter of the previous year, then the family will receive additional assistance for each child falling within the specified age range. The benefit amount is equal to half the child’s subsistence level. On average, this works out to be about 4.5-5 thousand rubles per month per child. If there are several children in the family from 3 to 7 years old, then the help will be many times greater.
Let's use a simple example to show how you can find out whether you are entitled to benefits or not. Our family consists of 4 people: mother, father, 18-year-old son and 5-year-old daughter. Before paying personal income tax, the father receives 22,000 rubles, the mother - 18,000 rubles. My son doesn’t work and doesn’t receive a scholarship. The family has no other income.
Simple calculations show that the family earns 480,000 rubles per year. If we divide this figure by 12 months, and then by the total number of family members, it turns out that the average per capita income is 10,000 rubles.
Our family lives in the Omsk region. If we compare the average per capita income with the cost of living in the Omsk region for the second quarter of 2019, we will see that the income of our heroes does not reach the figure, which means they can receive assistance from the state for their five-year-old daughter.
Living wage established in the regions for the first quarter of 2022 (Rosstat data)
| Region | General PM for the population | Children | Pensioners | Working population |
| Central District | ||||
| Belgorod region | 9 236 | 9 126 | 7 664 | 9 971 |
| Bryansk region | 10 537 | 10 334 | 8 751 | 11 305 |
| Vladimir region | 10 280 | 10 380 | 8 657 | 11 205 |
| Voronezh region | 8 894 | 8 697 | 7 513 | 9 689 |
| Ivanovo region | 10 123 | 10 140 | 8 477 | 11 012 |
| Kaluga region | 10 761 | 10 609 | 8 919 | 11 580 |
| Kostroma region | 10 337 | 10 234 | 8 679 | 11 277 |
| Kursk region | 9750 | 9 792 | 8 102 | 10 460 |
| Lipetsk region | 9 345 | 9 553 | 7 835 | 10 095 |
| Moscow region | 12 536 | 12 248 | 9 411 | 13 876 |
| Oryol Region | 10 071 | 10 108 | 8 371 | 10 788 |
| Ryazan Oblast | 9 914 | 9 875 | 8 250 | 10 710 |
| Smolensk region | 10 402 | 10 154 | 8 647 | 11 179 |
| Tambov Region | 9 887 | 9 748 | 8 478 | 10 650 |
| Tver region | 10 671 | 11 235 | 8 844 | 11 524 |
| Tula region | 10 553 | 10 388 | 8 937 | 11 311 |
| Yaroslavl region | 10 100 | 10 184 | 8 228 | 11 082 |
| Moscow | 17 129 | 14 812 | 12 126 | 19 544 |
| Northwestern District | ||||
| Republic of Karelia | 13 611 | 12 869 | 11 401 | 14 798 |
| Komi Republic | 13 791 | 13 691 | 11 366 | 14 868 |
| Nenets Autonomous Okrug | 21 367 | 22 119 | 17 464 | 22 572 |
| Arhangelsk region | 12 723 | 12 524 | 10 590 | 13 873 |
| Vologda Region | 10 869 | 10 792 | 9 023 | 11 823 |
| Kaliningrad region | 11 521 | 10 944 | 9 453 | 12 395 |
| Leningrad region | 11 129 | 10 701 | 9 489 | 12 060 |
| Murmansk region | 17 162 | 17 254 | 14 231 | 17 849 |
| Novgorod region | 10 899 | 10 761 | 9 055 | 11 842 |
| Pskov region | 10 855 | 10 680 | 8 964 | 11 772 |
| Saint Petersburg | 11 562 | 11 273 | 9 381 | 12 690 |
| Southern District | ||||
| Republic of Adygea | 9 354 | 9 568 | 7 669 | 9 955 |
| Republic of Kalmykia | 9 940 | 10 114 | 7 972 | 10 383 |
| Republic of Crimea | 10 387 | 10 957 | 8 522 | 11 102 |
| Krasnodar region | 10 805 | 10 398 | 8 943 | 11 675 |
| Astrakhan region | 10 291 | 11 011 | 8 611 | 10 776 |
| Volgograd region | 9 575 | 9 700 | 7 775 | 10 280 |
| Rostov region | 10 354 | 10 839 | 8 394 | 11 011 |
| Sevastopol | 10 724 | 11 458 | 8 798 | 11 469 |
| North Caucasus District | ||||
| The Republic of Dagestan | 9 934 | 10 146 | 7 833 | 10 199 |
| The Republic of Ingushetia | 10 214 | 10 632 | 8 032 | 10 553 |
| Kabardino-Balkarian Republic | 10 872 | 11 472 | 8 551 | 11 330 |
| Karachay-Cherkess Republic | 9 870 | 10 163 | 7 989 | 10 386 |
| Republic of North Ossetia-Alania | 9 480 | 9 760 | 7 652 | 10 019 |
| Chechen Republic | 11 156 | 11 118 | 9 186 | 11 531 |
| Stavropol region | 9 414 | 9 779 | 7 682 | 10 058 |
| Privolzhsky district | ||||
| Republic of Bashkortostan | 9 442 | 9 519 | 7 695 | 10 025 |
| Mari El Republic | 9 460 | 9 779 | 7 742 | 10 081 |
| The Republic of Mordovia | 9 181 | 9 442 | 7 592 | 9 914 |
| Republic of Tatarstan | 9 252 | 9 333 | 7 546 | 9 841 |
| Udmurt republic | 9 760 | 9 867 | 7 926 | 10 333 |
| Chuvash Republic | 9 285 | 9 254 | 7 576 | 9 875 |
| Perm region | 10 556 | 10 703 | 8 703 | 11 338 |
| Kirov region | 10 330 | 10 461 | 8 453 | 11 054 |
| Nizhny Novgorod Region | 10 005 | 10 283 | 8 311 | 10 803 |
| Orenburg region | 9 209 | 9 571 | 7 632 | 9 828 |
| Penza region | 9 217 | 9 500 | 7 697 | 9 962 |
| Samara Region | 10 329 | 10 285 | 8 246 | 11 421 |
| Saratov region | 9 138 | 9 451 | 7 565 | 9 849 |
| Ulyanovsk region | 10 011 | 10 225 | 8 230 | 10 741 |
| Ural district | ||||
| Kurgan region | 9 972 | 10 509 | 8 271 | 10 630 |
| Sverdlovsk region | 10 376 | 11 030 | 8 486 | 11 053 |
| Khanty-Mansiysk Autonomous Okrug | 15 332 | 15 343 | 12 500 | 16 472 |
| Yamalo-Nenets Autonomous Okrug | 15 914 | 15 887 | 12 526 | 16 636 |
| Tyumen region | 11 220 | 11 511 | 9 011 | 11 798 |
| Chelyabinsk region | 10 440 | 10 849 | 8 661 | 11 183 |
| Siberian district | ||||
| Altai Republic | 10 327 | 10 405 | 8 577 | 10 685 |
| Tyva Republic | 10 742 | 11 395 | 8 501 | 11 074 |
| The Republic of Khakassia | 11 107 | 11 783 | 8 905 | 11 693 |
| Altai region | 9 704 | 9 773 | 8 392 | 10 365 |
| Krasnoyarsk region | 12 591 | 13 170 | 9 843 | 13 321 |
| Irkutsk region | 11 655 | 12 130 | 9 434 | 12 383 |
| Kemerovo region | 10 073 | 10 544 | 8 138 | 10 653 |
| Novosibirsk region | 11 454 | 11 874 | 9 196 | 12 158 |
| Omsk region | 9 866 | 10 143 | 7 957 | 10 439 |
| Tomsk region | 11 528 | 12 115 | 9 310 | 12 234 |
| Far Eastern District | ||||
| The Republic of Buryatia | 11 715 | 12 273 | 9 272 | 12 163 |
| Transbaikal region | 12 736 | 13 480 | 10 066 | 13 221 |
| The Republic of Sakha (Yakutia) | 17 567 | 18 383 | 14 076 | 18 579 |
| Kamchatka Krai | 20 780 | 22 326 | 16 478 | 21 796 |
| Primorsky Krai | 13 628 | 15 003 | 10 984 | 14 422 |
| Khabarovsk region | 14 771 | 15 760 | 11 885 | 15 666 |
| Amur region | 12 525 | 13 087 | 10 166 | 13 299 |
| Magadan Region | 19 997 | 21 157 | 15 871 | 21 162 |
| Sakhalin region | 15 212 | 16 629 | 12 174 | 16 184 |
| Jewish Autonomous Region | 14 893 | 15 538 | 12 074 | 15 831 |
| Chukotka Autonomous Okrug | 22 365 | 23 142 | 17 233 | 22 982 |
There are no official data on the cost of living for the second quarter of 2020 yet, but we are closely monitoring updated information on the Rosstat website. As soon as information becomes available, this material will be updated immediately. If you need urgent money to borrow on a card, we recommend making your selection here.
Forecast
Obviously, the value will only increase in the coming years. This is due to the fact that inflation is unlikely to stabilize and prices for essential goods will rise. The indicator may also increase due to the expansion of the minimum consumer basket. Since January 2022, specialists from the Ministry of Labor have been studying the relevant issue. In particular, it is expected that it will increase the content of:
- meat by 5%.
- cottage cheese and eggs by 14%.
- fish by 16%.
- poultry meat by 11%.
If this set of measures is adopted, this will automatically increase the cost of living. However, time will tell how this figure will grow. It is highly desirable that it reflects the real state of affairs.
December 2022. At the same time, Belgorod pensioners, according to official data, could be content with 7257 in order not to feel poor.
Children
Interesting information on the children's living wage. In September-December 2022, it was determined for the Russian Federation at 10,383 rubles. Moreover, in the most remote regions it exceeds the figures calculated by statistics for working-age citizens, amounting to 23,066 for Chukotka, 21,842 for Kamchatka and 20,887 for Magadan for the same period in 2022.
This fact is probably associated with the higher price of fruits and vegetables, of which children especially need a lot for growth and development. In Moscow, the cost of living for children is already inferior to that of adults, amounting to 14,647 rubles for the same period. And according to statisticians in the Belgorod region, only 8,474 are spent on local children to maintain their proper standard of living.
Self-study documents
Moscow City Law No. 23 “On the cost of living in the city of Moscow” (10/27/2021)
Federal Law N 178-FZ “On State Social Assistance” (07/01/2021)
Federal Law No. 44-FZ “On the procedure for recording income and calculating the average per capita income of a family and the income of a citizen living alone for recognizing them as low-income and providing them with state social assistance” (04/24/2020)
Decree of the Government of the Russian Federation N 512 “On the list of types of income taken into account when calculating the average per capita family income and the income of a citizen living alone to provide them with state social assistance” (09.11.2021)
Federal Law N 134-FZ “On the subsistence minimum in the Russian Federation” (06.12.2021)
Did you find this information useful?
0 0
Forecast
Obviously, the value will only increase in the coming years. This is due to the fact that inflation is unlikely to stabilize and prices for essential goods will rise. The indicator may also increase due to the expansion of the minimum consumer basket. Since January 2022, specialists from the Ministry of Labor have been studying the relevant issue. In particular, it is expected that it will increase the content of:
- Meat by 5%.
- Cottage cheese and eggs by 14%.
- Pisces by 16%.
- Poultry meat by 11%.
If this set of measures is adopted, this will automatically increase the cost of living. However, time will tell what kind of growth there will be. It is highly desirable that it reflects the real state of affairs.