What is the cost of living in Russia in 2022?
The subsistence level (LS) per capita in Russia in 2022 increased by 1,001 rubles compared to 2022. In percentage terms, the increase was 8.6%. The amounts of PM for the main socio-demographic groups have also been increased accordingly: for the working population, pensioners and children.
“It should be noted that the PM for this year in Russia was established twice. First, it was approved by Decree of the Government of the Russian Federation dated June 30, 2021 No. 1070. According to this document, growth compared to last year should have been 2.5%. But by decision of President Vladimir Putin, the PM was increased not by 2.5%, but by 8.6%,” says Top-RF.ru economic observer Dmitry Danilov.
By the way, along with the living wage, President Putin proposed increasing the minimum wage for 2022 by 8.6%, which was done.
As a result, Decree of the Government of the Russian Federation dated June 30, 2021 No. 1070 is not applied today. And the cost of living for 2022 is established by a completely different document - Federal Law No. 390-FZ dated December 6, 2021.
In particular, paragraph 4 of Article 8 of Law No. 390-FZ states:
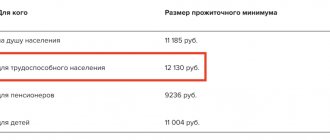
“In 2022, set the minimum subsistence level for the Russian Federation as a whole per capita at 12,654 rubles, for the working population - 13,793 rubles, pensioners - 10,882 rubles, children - 12,274 rubles."
Regional subsistence minimums are calculated based on the federal subsistence level.
State of the country
According to the latest data, about 10% of Russian citizens live below the poverty line.
They do not receive the minimum means necessary for a decent existence.
Children's question
The national average cost of living per child is 9,770 rubles. The corresponding resolution was signed by D. Medvedev. Child benefits will increase quarterly. It is believed that by the end of 2022 they will increase by 10%.
From 2022, the basket of necessary products will be calculated in a new way. Now the components of the basket are divided in half: 50% are food products, 50% are non-food goods and services.
The establishment of a living wage is determined precisely by these figures. Tax fees and other obligatory payments are also taken into account.
The lowest cost of living per child is registered in the Voronezh region. It is 8976 rubles
The highest children's PM is in Moscow. The standards are quite high in the Chukotka District, where the size of the children's monthly allowance is 22,222 rubles (it increased by 1,413 rubles)
The lowest values are in the Voronezh region. There, the size of the children's PM is 8976 rubles and has increased by 550 rubles.
Question from pensioners
The living wage for a pensioner is 8,600 rubles. This figure is slightly higher than the 2016 figure of 8.0 thousand rubles. But it does not live up to the forecasts expressed by some experts.
The adjustment of the PM is due to the consequences of the economic crisis that broke out in 2014-15.
Another reason is the growing budget deficit.
The new living wage takes into account statistical data on price fluctuations on the market.
According to existing legislation, the country's authorities undertake to compensate the difference between the established minimum wage and the amount of pension payments. Representatives of the Ministry of Labor predict that already in 2022 the state will pay more than 4,000,000 pensioners the money they need for a decent existence.
Today, the size of the monthly pension for pensioners in the Chukotka District is 16,031 rubles. It increased by 926 rubles. Low indicators in the Voronezh region. There, the size of the monthly pension for people of retirement age is 7,183 rubles. It increased by 237 rubles.
In the Khanty-Mansiysk Autonomous Okrug, the level of pension PM is today 11,594 rubles, having decreased by 100 rubles.
How is the cost of living calculated in the regions of Russia in 2022?
Previously, the size of the regional subsistence level - just like the federal one - was established on the basis of the cost of the consumer basket.
Now it is calculated in relation to the federal subsistence minimum. The basis for the calculations was the table of “ regional differentiation coefficients ,” which “reflect the difference in pricing and natural and climatic conditions of the territories.”
“These coefficients adjust the cost of living either upward (if we are talking about the northern territories or regions such as Moscow, where the cost of living is higher), or downward in regions where prices for goods and services are lower,” - explains Vice-Rector of the Financial University under the Government of the Russian Federation Alexander Safonov.
For example, in Moscow the cost of living should be 20% higher than the federal one, and in the Moscow region - only 3%.
In St. Petersburg, the cost of living should be 9% higher than the federal value, and in the Leningrad region - 7% higher.
Regional differentiation coefficients
(used to calculate regional subsistence levels per capita, approved by Decree of the Government of the Russian Federation of June 26, 2022 No. 1022)
| The subject of the Russian Federation | Coef. |
| Altai region | 0,89 |
| Amur region | 1,15 |
| Arkhangelsk region | 1,16 |
| Astrakhan region | 0,97 |
| Belgorod region | 0,84 |
| Bryansk region | 0,92 |
| Vladimir region | 0,97 |
| Volgograd region | 0,86 |
| Vologda region | 1,01 |
| Voronezh region | 0,88 |
Show more ↓
| The subject of the Russian Federation | Coef. |
| Moscow | 1,20 |
| Saint Petersburg | 1,09 |
| Sevastopol | 1,02 |
| Jewish auto. region | 1,25 |
| Transbaikal region | 1,17 |
| Ivanovo region | 0,94 |
| Irkutsk region | 1,06 |
| Kabardino-Balkarian Republic | 1,07 |
| Kaliningrad region | 1,03 |
| Kaluga region | 0,96 |
| Kamchatka Krai | 1,76 |
| Karachay-Cherkess Republic | 0,94 |
| Kemerovo region. | 0,91 |
| Kirov region | 0,89 |
| Kostroma region | 0,92 |
| Krasnodar region | 0,96 |
| Krasnoyarsk region | 1,11 |
| Kurgan region | 0,94 |
| Kursk region | 0,87 |
| Leningrad region. | 1,07 |
| Lipetsk region | 0,83 |
| Magadan region | 1,74 |
| Moscow region | 1,03 |
| Murmansk region | 1,32 |
| Nenets Autonomous Okrug | 1,64 |
| Nizhny Novgorod region. | 0,94 |
| Novgorod region | 0,98 |
| Novosibirsk region | 0,98 |
| Omsk region | 0,87 |
| Orenburg region | 0,87 |
| Oryol region | 0,93 |
| Penza region | 0,84 |
| Perm region | 0,92 |
| Primorsky Krai | 1,19 |
| Pskov region | 0,99 |
| Rep. Adygea (Adygea) | 0,86 |
| Rep. Altai | 0,95 |
| Rep. Bashkortostan | 0,89 |
| Rep. Buryatia | 1,09 |
| Rep. Dagestan | 0,91 |
| Rep. Ingushetia | 0,94 |
| Rep. Kalmykia | 0,98 |
| Rep. Karelia | 1,11 |
| Rep. Komi | 1,15 |
| Rep. Crimea | 0,97 |
| Rep. Mari El | 0,88 |
| Rep. Mordovia | 0,85 |
| Rep. Sakha (Yakutia) | 1,51 |
| Rep. North Ossetia Alania | 0,90 |
| Rep. Tatarstan | 0,85 |
| Rep. Tyva | 1,01 |
| Rep. Khakassia | 1,02 |
| Rostov region | 0,94 |
| Ryazan region | 0,89 |
| Samara region | 0,94 |
| Saratov region | 0,84 |
| Sakhalin region | 1,36 |
| Sverdlovsk region. | 0,99 |
| Smolensk region | 0,99 |
| Stavropol region | 0,90 |
| Tambov region | 0,83 |
| Tver region | 0,98 |
| Tomsk region | 0,98 |
| Tula region | 1,00 |
| Tyumen region | 1,00 |
| Udmurt Republic | 0,89 |
| Ulyanovsk region | 0,89 |
| Khabarovsk region | 1,22 |
| Khanty-Mansiysk Autonomous Region district - Ugra | 1,11 |
| Chelyabinsk region | 0,92 |
| Chechen Republic | 0,96 |
| Chuvash Republic | 0,87 |
| Chukotka Autonomous Republic district | 2,61 |
| Yamalo-Nenets Aut. district | 1,37 |
| Yaroslavl region | 1,00 |
However, the constituent entities of the Russian Federation should switch completely to the new system for calculating the cost of living, based on the coefficients of regional differentiation, only by 2025. And before that, they can gradually increase the amount up to a certain coefficient.
For example, in St. Petersburg the authorities did just that. The Decree of the Governor of St. Petersburg established the following ratios of the subsistence level in St. Petersburg to the federal subsistence level: 1.04 in 2022, 1.05 in 2023, 1.07 in 2024 and 1.09 in 2025.
At the same time, as the Ministry of Labor has repeatedly emphasized, regions have the right to set a living wage higher than the level proposed to them by the center.
Forecast
Obviously, the value will only increase in the coming years. This is due to the fact that inflation is unlikely to stabilize and prices for essential goods will rise. The indicator may also increase due to the expansion of the minimum consumer basket. Since January 2022, specialists from the Ministry of Labor have been studying the relevant issue. In particular, it is expected that it will increase the content of:
- meat by 5%.
- cottage cheese and eggs by 14%.
- fish by 16%.
- poultry meat by 11%.
If this set of measures is adopted, this will automatically increase the cost of living. However, time will tell how this figure will grow. It is highly desirable that it reflects the real state of affairs.
December 2022. At the same time, Belgorod pensioners, according to official data, could be content with 7257 in order not to feel poor.
Children
Interesting information on the children's living wage. In September-December 2022, it was determined for the Russian Federation at 10,383 rubles. Moreover, in the most remote regions it exceeds the figures calculated by statistics for working-age citizens, amounting to 23,066 for Chukotka, 21,842 for Kamchatka and 20,887 for Magadan for the same period in 2022.
This fact is probably associated with the higher price of fruits and vegetables, of which children especially need a lot for growth and development. In Moscow, the cost of living for children is already inferior to that of adults, amounting to 14,647 rubles for the same period. And according to statisticians in the Belgorod region, only 8,474 are spent on local children to maintain their proper standard of living.
How are PMs calculated by socio-demographic groups?
The methodology for calculating the cost of living for the main socio-demographic groups of the population today is also based on coefficients.
According to the rules (approved by Decree of the Government of the Russian Federation of June 26, 2022 No. 1022), in order to calculate the minimum wage for the working population, children or pensioners, the average income per capita must be multiplied by the appropriate coefficient.
• 1.09 - to calculate the PM value for the working population; • 0.86 - to calculate the pensioner’s PM value; • 0.97 – to calculate the PM value of children.
You can create formulas for calculating the cost of living for the main groups of the population.
Formula for calculating the monthly minimum wage for the working population
PM so-called = PM d.s. * 1.09,
Where
PM so-called — living wage for the working population for the current year, PM Doctor of Science. — living wage per capita for the current year.
Formula for calculating PM for pensioners
PM p. = PM d.s. * 0.86,
Where
PM p. - living wage for pensioners for the current year, PM d.s. — living wage per capita for the current year.
Formula for calculating PM for children
PM d. = PM d.s. * 0.97,
Where
PM d. - living wage for children for the current year, PM d.n. — living wage per capita for the current year.
Living wage 2022: table by region
By socio-demographic groups, rubles per month
| — | Per capita | working population | pensioners | children |
| RF | 12654 | 13793 | 10882 | 12274 |
.
Central Federal District
| The subject of the Russian Federation | Per capita | working population | pensioners | children |
| Belgorod region | 10629 | 11586 | 9141 | 10310 |
| Bryansk region | 11934 | 13008 | 10432 | 11856 |
| Vladimir region | 12274 | 13379 | 10556 | 11906 |
| Voronezh region | 10756 | 11724 | 9796 | 10433 |
| Ivanovo region | 11642 | 12690 | 10012 | 11443 |
| Kaluga region | 12148 | 13241 | 10447 | 12058 |
| Kostroma region | 11691 | 12755 | 10123 | 11734 |
| Kursk region | 11009 | 12000 | 9510 | 11052 |
| Lipetsk region | 10503 | 11448 | 9190 | 10654 |
| Moscow region | 14748 | 16075 | 12683 | 14306 |
| Oryol region | 11768 | 12827 | 10120 | 11415 |
| Ryazan region | 11262 | 12276 | 9694 | 11335 |
| Smolensk region | 12148 | 13241 | 10447 | 11784 |
| Tambov region | 11100 | 12099 | 10204 | 10767 |
| Tver region | 12148 | 13241 | 10447 | 12369 |
| Tula region | 12401 | 13517 | 10665 | 12029 |
| Yaroslavl region | 11895 | 12966 | 10230 | 11562 |
| Moscow | 18714 | 21371 | 14009 | 16174 |
Show more ↓ Northwestern Federal District
| The subject of the Russian Federation | Per capita | working population | pensioners | children |
| Rep. Karelia | 15104 | 16463 | 13345 | 14651 |
| Rep. Komi | 15368 | 16751 | 13340 | 15510 |
| Nenets Aut. district | 23108 | 25188 | 20127 | 24144 |
| Arkhangelsk region without car districts | 14679 | 16000 | 12624 | 14368 |
| Vologda region | 12781 | 13931 | 10992 | 12398 |
| Kaliningrad region | 13034 | 14207 | 11209 | 12643 |
| Leningrad region. | 12781 | 13931 | 10992 | 12398 |
| Murmansk region | 20227 | 22047 | 17395 | 19620 |
| Novgorod region | 12401 | 13517 | 10665 | 12029 |
| Pskov region | 12527 | 13654 | 10773 | 12250 |
| Saint Petersburg | 13160,20 | 14344,60 | 11317,80 | 12765,40 |
Southern Federal District
| The subject of the Russian Federation | Per capita | working population | pensioners | children |
| Rep. Adygea | 10882 | 11861 | 9359 | 10925 |
| Rep. Kalmykia | 11768 | 12827 | 10120 | 11866 |
| Rep. Crimea | 12274 | 13379 | 10556 | 12720 |
| Krasnodar region | 12148 | 13241 | 10447 | 11784 |
| Astrakhan region | 12274 | 13379 | 10556 | 12882 |
| Volgograd region | 10882 | 11861 | 9381 | 10831 |
| Rostov region | 11895 | 12966 | 10230 | 12108 |
| Sevastopol | 12654 | 13793 | 10882 | 13332 |
North Caucasus Federal District
| The subject of the Russian Federation | Per capita | working population | pensioners | children |
| Rep. Dagestan | 11515 | 12551 | 9903 | 11499 |
| Rep. Ingushetia | 11895 | 12966 | 10230 | 12190 |
| Kabardino-Balkarian Republic | 13540 | 14759 | 11644 | 14368 |
| Karachay-Cherkess Republic | 11515 | 12551 | 9903 | 12001 |
| Rep. North Ossetia Alania | 11389 | 12414 | 9795 | 11281 |
| Chechen Republic | 12148 | 13241 | 10447 | 11784 |
| Stavropol region | 11389 | 12414 | 9795 | 11047 |
Volga Federal District
| The subject of the Russian Federation | Per capita | working population | pensioners | children |
| Rep. Bashkortostan | 11009 | 12000 | 10431 | 10679 |
| Rep. Mari El | 11136 | 12138 | 9577 | 11441 |
| Rep. Mordovia | 10756 | 11724 | 9390 | 10565 |
| Rep. Tatarstan | 10756 | 11724 | 9250 | 10433 |
| Udmurt Republic | 11262 | 12276 | 9685 | 11144 |
| Chuvash Republic | 10756 | 11724 | 9250 | 10433 |
| Perm region | 11642 | 12690 | 10012 | 11569 |
| Kirov region | 11262 | 12276 | 9750 | 11536 |
| Nizhny Novgorod region. | 11895 | 12966 | 10230 | 11538 |
| Orenburg region | 11009 | 12000 | 9468 | 10834 |
| Penza region | 10629 | 11586 | 9381 | 10402 |
| Samara region | 11895 | 12966 | 10230 | 11538 |
| Saratov region | 10629 | 11586 | 9141 | 11067 |
| Ulyanovsk region | 11262 | 12246 | 9685 | 11365 |
Ural federal district
| The subject of the Russian Federation | Per capita | working population | pensioners | children |
| Kurgan region | 11895 | 12966 | 10230 | 11910 |
| Sverdlovsk region. | 12274 | 13379 | 10556 | 12869 |
| Khanty-Mansiysk Autonomous Region district - Ugra | 16932 | 18456 | 14606 | 16958 |
| Yamalo-Nenets Aut. district | 18029 | 19652 | 15505 | 17579 |
| Tyumen region without car districts | 12654 | 13793 | 10882 | 12475 |
| Chelyabinsk region | 11887 | 12957 | 10223 | 12444 |
Siberian Federal District
| The subject of the Russian Federation | Per capita | working population | pensioners | children |
| Rep. Altai | 11895 | 12966 | 10230 | 11538 |
| Rep. Tyva | 12781 | 13931 | 10992 | 12702 |
| Rep. Khakassia | 12907 | 14069 | 11100 | 13009 |
| Altai region | 11262 | 12276 | 10396 | 11524 |
| Krasnoyarsk region | 14046 | 15310 | 12080 | 14645 |
| Irkutsk region | 13413 | 14620 | 11535 | 13269 |
| Kemerovo region. | 11515 | 12551 | 9903 | 11704 |
| Novosibirsk region | 12775 | 13925 | 10987 | 13238 |
| Omsk region | 11305 | 12322 | 9722 | 11674 |
| Tomsk region | 12731 | 13877 | 10949 | 13470 |
Far Eastern Federal District
| The subject of the Russian Federation | Per capita | working population | pensioners | children |
| Rep. Buryatia | 13793 | 15034 | 11862 | 14086 |
| Rep. Sakha (Yakutia) | 19108 | 20828 | 16433 | 19854 |
| Transbaikal region | 14805 | 16137 | 12732 | 15669 |
| Kamchatka Krai | 22930 | 24994 | 19720 | 24422 |
| Primorsky Krai | 15058 | 16413 | 12950 | 16025 |
| Khabarovsk region | 16871 | 18389 | 14509 | 18586 |
| Amur region | 14704 | 16027 | 12645 | 15635 |
| Magadan region | 22018 | 24000 | 18935 | 24326 |
| Sakhalin region | 17209 | 18758 | 14800 | 17992 |
| Jewish auto. region | 17053 | 18588 | 14666 | 17150 |
| Chukotka Autonomous Republic district | 28851 | 31448 | 24812 | 27985 |


