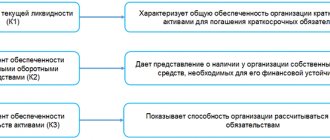
What does the ratio of inventory coverage with own working capital mean?
This indicator is used to assess the financial stability of the company. Among other coefficients that determine the security of an enterprise with its own capital, the one under consideration shows whether the working capital covers the optimal volume of the subject’s reserves.
In other words, the indicator is able to characterize which funds were used more when creating reserves: own or borrowed funds. The greater the share of borrowed funds, the less stable the business, the less its investment attractiveness.
What does the inventory coverage ratio show?
The ratio under consideration refers to the key indicators of the financial stability of the company: it allows you to assess whether the enterprise has enough working capital in terms of ensuring the optimal level of inventories.
In general, the ratio reflects the ratio of the company's own working capital to its inventories in the analyzed period. In turn, own working capital can consist of equity capital and long-term liabilities, reduced by non-current assets. In some cases, deferred income is also added to the amount of equity capital and long-term liabilities.
It is also possible that the ratio will be considered as the ratio of the difference between current assets and short-term liabilities to inventories.
There are quite a few approaches and criteria according to which the amount of reserves in an organization is determined. In many cases, Russian accountants use international experience and determine the structure of inventories, thus, in accordance with IFRS criteria.
For more information on determining reserves in accordance with IFRS standards, read the article “IFRS No. 2 Inventories - features of application and purposes.”
Let us next consider what the formulas for calculating our coefficient may look like.
Inventory coverage ratio: balance formula
All the given components of the calculation are taken from the financial statements. Taking into account the balance line codes, the formula takes the form:
| Inventory supply ratio on balance sheet | = | (Page 1300 + Page 1400 – Page 1100) / Page 1210 | or | (Page 1200 – Page 1500) / Page 1210 |
To line 1300 it is allowed to add deferred income from line 1530 (property received free of charge and government assistance), because The Ministry of Finance equates them to the equity capital of the enterprise (clause 6 of the Procedure for calculating net assets, approved by Order of the Ministry of Finance No. 84n dated August 28, 2014).
Working capital coverage ratio
The fixed assets coverage ratio with own funds is a value that reflects the share of current assets that are covered by own funds remaining after investing in non-current assets. The indicator is determined by this formula:
(Line 1300 – line 1100) / Line 1200.
All values are taken from the balance sheet. The standard value is 0.1. It makes sense to monitor changes in the indicator, that is, to observe it in dynamics. Changing the value allows you to draw the following conclusions:
- A value above the norm means the ability to finance a large number of current assets.
- The value is below the norm - the balance of your funds does not cover a larger amount of working capital.
- The value increases - a positive sign.
- The value decreases - a negative sign.
The exact value of the parameter depends on the specific conditions.
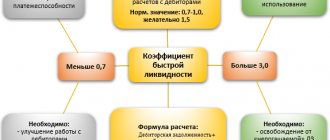
Inventory and cost coverage ratio: standard values
Variations of the indicator depend on the specifics of the activity.
The normal limits for it are considered to be 0.6-0.8, i.e. when from 60% to 80% of reserves are formed from equity capital.
In general, a value above 0.5 is also a good result.
Values below 0.5 mean a large credit load and a significant share of the least liquid (non-current) assets.
A negative coefficient value indicates:
- that almost all of the company's funds are invested in non-current assets (for example, equipment, structures, cars and other fixed assets). The financial situation in this case is very unstable and is accompanied by a low degree of liquidity;
- that a large share of funds raised is short-term loans and credits. Moreover, if inventories have a high turnover rate, i.e. are quickly sold and generate income, a negative value may be the norm.
When analyzing, special attention should be paid to the dynamics of the coefficient over several periods of time.
Inventory coverage ratio: interpretation
The optimal value of the coefficient under consideration is 0.6–0.8. This means that about 60–80% of a firm's inventory is produced or purchased using its own capital. If this indicator is lower, this may indicate an excessive credit burden on the business.
If it is larger, then perhaps the company’s own capital is not invested very effectively (but this, of course, is a very controversial interpretation; it is only valid in cases where loan rates are significantly lower than the profitability of the business).
Actually, the fact that the company has a sufficient amount of capital to ensure the required volumes of inventories reduces its need for loans. In general, the higher the coefficient under consideration, the more investment attractive the enterprise can be.
In some cases, the coefficient can also take a negative value. As a rule, this means that the company’s working capital indicator is also negative. Most often, this situation arises if the company has a high credit load, but the company’s business model may provide for the prompt conversion of inventories into revenue - if their turnover is characterized by good dynamics. If this is so, then a negative equity ratio in the company will be considered the norm.
Read more about inventory turnover in the article “Inventory turnover ratio in days (formula).”
Thus, the standard for this coefficient can be determined taking into account the specifics of the company’s business model.
The coefficient, the calculation of which we have considered, is best compared in dynamics. For example, using data on balance sheets in different years. A drawdown recorded in one period can be compensated by a sharp increase in the value of the corresponding indicator in other time periods, so its average value may well be considered to correspond to the optimal level. Investors, studying indicators of financial stability, such as the inventory coverage ratio, usually make decisions based on their consideration in the context of comparison with the results of the enterprise's activities in different periods.
Inventory coverage ratio with own funds: calculation examples
Let us present information from the reports of different organizations and compare the results of coefficient calculations:
| Indicator (balance line code) | LLC "Zvezda" | LLC "Light" | LLC "Star" |
| Net worth (1300) | 17 323 | 395 | 1 529 |
| Long-term liabilities (1400) | 120 | 1 002 | 0 |
| Non-current assets (1100) | 9 750 | 986 | 556 |
| Current assets (1200) | 11 883 | 2 312 | 1 850 |
| Current liabilities (1500) | 4 190 | 1 901 | 877 |
| Inventories (1210) | 5 869 | 983 | 1 350 |
| 1 calculation option (Page 1300 + Page 1400 – Page 1100) / Page 1210 | (17 323 + 120 – 9 750) / 5 869 | (395 + 1 002 – 986) / 983 | (1 529 + 0 – 556) / 1 350 |
| 2 calculation option (Page 1200 – Page 1500) / Page 1210 | (11 883 – 4 190) / 5 869 | (2 312 – 1 901) / 983 | (1 850 – 877) / 1 350 |
| Result | 1,31 | 0,42 | 0,72 |
| Conclusion | Complete independence of the enterprise from borrowed funds, but perhaps not enough reserves for the uninterrupted implementation of a continuous production process | Large volume of non-current assets and short-term loans. It is recommended to consider the possibility of selling unused equipment and using funds to repay loans, because the result shows a high dependence of reserves on external sources of financing | Star LLC successfully uses its capital and attracts credit funds in reasonable measures, so 72% of the organization’s reserves do not depend on third-party sources of financing, which is a sign of sustainable business development |
Standard value of the indicator of provision of reserves with own working capital:
The standard is 0.5 and above. The indicator should be considered in dynamics. An increase in the indicator indicates an increase in the company's sustainability in the medium term and a decrease in dependence on short-term sources of financing. A negative value of the indicator indicates that without short-term borrowed capital the company will not be able to ensure an uninterrupted production and sales process. With reduced opportunities to attract such funds, the operational process may come to a standstill.
Related materials
- Relative indicators of business activity (turnover)
- Accounts payable turnover ratio
- Inventory turnover ratio
- Working capital turnover ratio
- Asset turnover ratio
What formulas are used for calculation
The procedure for determining the ratio of the provision of own working capital based on indicators of financial and economic activity was approved by Order No. 16.
KO is calculated in two stages:
- Find the difference between capital and non-current assets.
- The result of the subtraction is divided into the current assets of the enterprise.
The formula is:
Another calculation option is by balance. The activity indicators from the formula appear in the balance sheet lines. To determine QoS, information from the following lines is used:
KOSOS = (p. 1300 - 1100) / 1200.
The obtained result characterizes the stability and liquidity of the funds. During normal operation of an enterprise, assets with low liquidity are covered by its capital. The remaining money of the company is used in current financial and economic activities.
SOS calculation
Each enterprise calculates the absolute value of its own resources in circulation. Based on this indicator, you can come to a conclusion about the structure of the balance sheet, and, if necessary, optimize it. Provision of own working capital is determined as follows:
SOS = Assets in circulation - Short-term liabilities
Based on balance sheet data, the formula looks like this:
SOS = s. 1200 - p. 1500
This is the approach officially adopted by the “Methodological Regulations for Assessing Financial Condition”. But, based on the economic meaning of the balance sheet structure, this formula can be presented in a different form:
SOS = Own capital + Long-term liabilities – Non-current assets.
According to the balance sheet, the calculation looks like this:
SOS = s. 1300 + s. 1530 - p. 1100
The first formula is simpler for calculations, so it is most often used. But in order to understand the organization of the balance sheet structure, it is necessary to understand the essence of the second calculation.