Why is the indicator needed?
The uninterrupted operation of an economic entity is impossible without economic and material resources.
When there is a shortage of supplies, it is problematic to ensure a full production cycle. But even with an excess of technical requirements, the rational use of resources is reduced: the company will have to ensure the safety of the surplus, distribute the excess among sales points, and revise the action plan to avoid overstocking. To solve these problems, an inventory turnover ratio is required, which is determined based on the results of an analysis of commodity turnover. This indicator reflects the rate of use of technical knowledge during the production cycle or other period of time. Correct prioritization will allow the company to rationally plan the procurement and use of materials, raw materials and finished products.
An economic analysis of technical tasks turnover will eliminate the following negative factors:
- eliminate interruptions in the supply of materials necessary for production;
- eliminate the staleness of goods and raw materials in warehouses;
- reduce the number of expired inventory items written off;
- reduce the cost of maintaining warehouse premises to ensure the safety of surplus goods;
- reduce the number of ineffective and unused inventory items;
- rationalize spending on labor resources involved in processing, delivery and storage of technical requirements.
IMPORTANT!
The standards do not indicate what the inventory turnover ratio for a certain period depends on: the value of the index is influenced by the industry characteristics of the enterprise, volumes of products sold, sales revenue, balances and a number of other indicators.
Interpretation of an increase or decrease in the coefficient
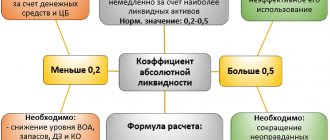
Inventory Turnover Ratio - Goats - shows how efficiently the company uses its warehouse capacity. Thus, a higher value of this indicator is more beneficial for the company and its employees.
A decrease in the level of the coefficient in relation to previous periods means either a general drop in sales with a constant amount of inventory, or an increase in inventory in the warehouse with a constant level of sales, or a drop in sales and a simultaneous increase in inventory.
How to count
When calculating the indicator, the average value of technical specifications is used. Note that inventory should be understood not only as raw materials and supplies used in the production cycle, but also as finished products intended for sale.
The average value is the average annual balance of goods. The economic indicator is calculated on the basis of accounting data. For example, in order to calculate the value for the year, it is necessary to add up the cost of raw materials and goods at the beginning of the reporting year and at the end of the year according to the balance sheet. The resulting amount is divided by 2. This is the average annual balance of goods.
ConsultantPlus experts analyzed what exactly belongs to reserves. Use these instructions for free.
Options for how inventory turnover is calculated in an organization:
Option 1. As the ratio of the average annual balance of goods to the cost of sales for the billing period:
Ratio = cost of sales / average annual balance of goods.
Option 2. As the ratio of sales revenue for the reporting period to the average annual balance of technical assignment:
Coefficient = sales revenue / average annual balance of technical assignment.
The second calculation method is used more often, as it allows one to obtain the most reliable results. With the first method of calculation, the cost is included in the calculation. But the procedure for determining the cost of sales is individual for each enterprise. For example, firms take management expenses into account in cost in different ways or highlight them as a separate line in the financial result.
Consequently, the second formula for calculating inventory turnover reflects the clearest picture: the result does not depend on the specifics of the accounting policy regarding the formation of product costs.
Turnover in days
In addition to the speed of turnover of commodity assets, companies calculate the turnover process in days.
IMPORTANT!
The calculated inventory turnover in days shows the period during which the raw materials used by the organization go through a full turnover. Based on the information received, the need for raw materials is determined, that is, for how many days of activity the existing products will be enough. Based on the results of the assessment, patterns of resource flow within the company are formed.
To determine the indicator, the formula for inventory turnover in days is used:
By balance
To calculate the indicator, information is used from the final accounting statements - the balance sheet and the income statement.
The correct formula for inventory turnover on the balance sheet consists of two parts:
- Average cost of raw materials = (line 1210 “Inventories” at the beginning of the period + line 1210 at the end of the period) / 2.
- Turnover ratio (if calculated at cost) = line 2120 “Cost of sales” / average from line 1210.
- Coefficient (if calculated by revenue) = line 2110 “Revenue” / average from line 1210.
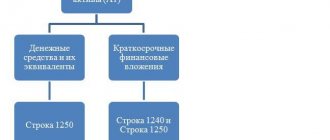
Type II service level.
Type II service level is the share of demand that we are guaranteed to cover using the stocks available in the warehouse during the replenishment period. Let's say the total demand for a product is 100 units per month, but there are only 70 units in stock, which were sold. Therefore, the level of service of type II is 70%. Read more about service level in the article “What is service level and why is it important.”
Level of service of the 2nd type in terms of money, % = amount of sales in monetary units. /(amount of sales units + lost demand units) * 100%
We recommend calculating this indicator in terms of money. If we take things into account, the analysis will be incorrect. Nails and a tractor are sold with different frequencies; it is impossible to compare their sales in units. When aggregating goods with unequal sales volumes, money is the most objective indicator by which we can evaluate something.
Can 100% service level be a guarantee of effective inventory management? No, this is not a guarantee. A 100% service level cannot be planned. In this case, for goods of rare demand there will be gigantic safety stocks for fluctuations in demand.
We can plan the level of service for the future, and then compare the results: what was planned and what we got in the end. We will tell you more about how to do this in the following lessons.
Let's look at how to calculate the efficiency of inventory management using an example. The image shows indicators for the outlet.
There is warehouse No. 1, No. 2, No. 3. The turnover at the outlet, the level of service, how many days there was a shortage, how much lost profit we received and other indicators were calculated. The analysis was carried out by point of sale and there is a breakdown into groups. We can go down to the level of each specific product and look at specific indicators of its effectiveness.
We often encounter problems when we want to compare performance indicators for one quarter of two years. This kind of comparative analysis helps you understand where you are going. The main thing is to look at all the indicators together - turnover, level of service, lost profit and others.
Let's practice. Which warehouse has the best insulation material inventory management?
The image shows data for three warehouses with efficiency indicators calculated for them. Warehouse No. 2 has the lowest turnover, but at the same time the highest level of service. This is a common situation. The higher the level of service, the lower the turnover. A large number of safety stocks leads to their lower turnover. Plus, this warehouse has the smallest lost profit.
There is a medium warehouse No. 3. There is an average turnover, level of service and lost profit. Warehouse No. 4 has the highest turnover, the highest lost profit and the lowest level of service of the three. Is it possible to conclude which warehouse manages inventory better? Hardly. In each specific case you need to figure out what will be good for you. Should we allow less lost profit due to low turnover or more lost profit, but at the same time provide higher turnover and a slightly lower level of service? To complete the picture, there are not enough other indicators. At a minimum, profit and inventory return. We must evaluate how much money we made last year and what inventory return we provided.
Turnover analysis
Having calculated the indicators, it is necessary to begin comparison and analysis. There are no standard values for the turnover ratio. Each economic entity independently determines regulatory standards, taking into account the specifics of the industry and activity.
A decrease in the turnover rate indicates overstocking. This is, in particular, affected by:
- ineffective management of inventory items;
- low level of safety of medical supplies in warehouses;
- accumulation of unsuitable shopping centers;
- poor planning;
- inefficient logistics;
- decrease in demand for manufactured products.
An increase in the coefficient does not indicate a favorable situation. On the contrary, a sharp jump in the indicator means that reserves are depleted. Causes:
- interruptions in the supply of medical supplies and goods and materials;
- rising prices for raw materials;
- discrepancy between the quality characteristics of reserves and the requirements of the technological cycle;
- the need to modernize equipment;
- the need to revise the schedule and timing of delivery, shipment, and processing of raw materials.
Standard value of inventory turnover:
According to the Rosselkhozbank methodology, the following value is considered normative:
Table 1. Standard value of the indicator by field of activity, once a year
| Index | Agriculture | Food and processing industries | Intermediaries, wholesalers and retailers | Others |
| Inventory turnover | 3-6 | 4,5-8 | 8-18 | 8-18 |
Source: Vasina N.V. Modeling the financial condition of agricultural organizations when assessing their creditworthiness: Monograph. Omsk: Publishing House NOU VPO OmGA, 2012. p. 49.
In the process of drawing conclusions, it is worth remembering that for a particular business segment, standard values may differ significantly. It is necessary to compare the indicator with the value of the main competitors. It is also necessary to consider it in dynamics - a constant increase in turnover indicates that there is a steady improvement in inventory management policy.
Average inventory
Another economic indicator used to analyze the supply of goods and materials is inventory. For analysis, average values are displayed, which reflect how much MH is in circulation for a certain period.
Here's how to find inventory turnover (average):
Average inventory = [(Item1 / 2) + Item2 + Item3 + (Item (DAY) / 2)] / (DAYS – 1),
Where:
- Tov1, Tov2, Tov3 - the amount of material reserves, raw materials or products on the 1st, 2nd and 3rd day of the analyzed period;
- Commodity (DAY) - the amount of material reserves, raw materials or products on the last day of the operating period;
- DAYS - the total number of days in the period.
The duration of the period can be chosen depending on the situation. Companies calculate the average monthly inventory or, for example, weekly, quarterly.
Example
A lawn mower company produces an annual inventory management report. The information collected by the CFO is shown in the table.
| Balance sheet item | Sum |
| Cost of goods sold | 4,075,000 |
| Direct materials costs | 1,550,000 |
| Raw materials reserves | 388,000 |
| Total stocks | 815,000 |
To calculate total inventory turnover, the CFO performs the following calculation:
CU 4,075,000 / CU 815,000 = 5 revolutions per year
To determine the turnover period, the financial director divides the number of turnovers by 365 days:
365 / 5 = 73 days
The CFO is also interested in the level of raw material turnover when compared to direct materials costs only, using this calculation:
Direct materials costs / Raw materials inventories = CU 1,550,000 / CU 388,000 = 4 revolutions per year
The next logical step for the CFO is to compare these results with those of previous years, as well as with the results achieved by other companies in the industry.
The result, which is probably not good in any industry, is that comparing direct materials with raw material inventories resulted in only 4 turns per year.
This means that the average material is in stock for 90 days before it is used, which is too long if a reliable production (sales) planning system is used.