Quick liquidity ratio: essence, economic meaning
This indicator can also be called the urgent, critical, intermediate liquidity ratio, critical assessment ratio, intermediate coverage ratio. A brief general description of the quick liquidity ratio is presented in the figure. A detailed description of the indicator is given below.
Quick liquidity ratio (KLR ) is the ratio of highly liquid current assets (cash, financial investments and receivables) to short-term liabilities. That is, production inventories are excluded from the calculation. The logic behind this exception is as follows:
a) inventories are the least liquid part of current assets
b) the funds received in the event of a forced sale of inventories may be significantly lower than the costs of their acquisition.
or:
The quick liquidity ratio reflects the projected payment ability of the enterprise, subject to timely settlements with debtors. A high value of the indicator indicates the stable financial condition and solvency of the enterprise.
This is one of three criteria characterizing the liquidity of an enterprise. It is of greatest interest to lending banks and potential investors.
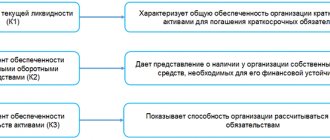
Basic liquidity ratios
Liquidity is a concept that is used to assess the ability of a legal entity to pay its current (short-term) debts at the expense of its own property, depending on the speed of sale of this property (its conversion into money).
Liquidity indicators are calculated in relation to the property that forms the current assets of the enterprise. It is divided according to the speed of sale:
- for highly liquid (not requiring sale or being sold very quickly) - this is money and short-term financial investments;
- quick-liquid (it takes some time to sell, but not for long) - this is a short-term debt of debtors;
- medium-liquid (will be sold after some time, but can be sold either not very quickly or with a loss of value) - these are inventories.
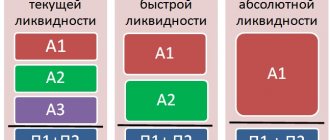
In relation to the speed of sale, liquidity is characterized by 3 types of coefficients:
- absolute liquidity ratio calculated for highly liquid property;
- urgent liquidity, determined by the amount of highly and quickly liquid assets (it is also called the quick, strict, intermediate or critical liquidity ratio);
- current liquidity, relating to the entire amount of current assets.
Each coefficient makes it possible to judge the solvency of a legal entity with its connection to a temporary assessment.
invites you to a free webinar “The nuances of applying FSBU 5/2019 “Reserves” on August 20 - don’t miss it.
Quick liquidity ratio: balance sheet formula
The company uses current assets converted into cash to pay off its debt. Therefore, liquidity and solvency can be assessed by comparing these balance sheet elements. To assess quick liquidity, we group the current assets of the balance sheet by the degree of liquidity, and short-term liabilities - by the maturity of the debt (balance sheet line codes are indicated in parentheses).
Asset grouping
Group A1 - the most liquid assets. This group includes cash (line 1250) and short-term financial investments (line 1240). Cash is ready for payment and settlement at any time, therefore it has absolute liquidity. Securities and similar short-term financial investments can be quickly sold on the stock exchange or other business entities. Therefore, they are also among the most liquid assets.
A1 = page 1240 + page 1250
Group A2 - quickly realizable assets. The basis of the group is accounts receivable, payments for which are expected within 12 months after the reporting date (line 1230) and other current assets (line 1260). The liquidity of funds invested in accounts receivable depends on the speed of payment document flow in banks, the timeliness of execution of bank documents, the timing of granting commercial loans to individual customers, their solvency, and forms of payment.
A2 = page 1230 + page 1260
Grouping of liabilities
Group P1 - the most urgent obligations. The basis of this group is accounts payable with a maturity of up to three months (line 1520), and other short-term liabilities (line 1550). There are several types of accounts payable: to suppliers and contractors, to company personnel, to extra-budgetary funds, to the state for taxes and duties, etc.
P1 = page 1520 + page 1550
Group P2 – medium-term liabilities. This group includes items of short-term borrowed funds (line 1510), maturing from three months to one year, and estimated liabilities (line 1540). There are two types of borrowed funds: loans and borrowings. Loans are provided by specialized organizations and at interest rates. Loans can be issued by any legal entity or individual. Moreover, they can be interest-free.
P2 = page 1510 + page 1540
Then the formula for calculating the quick liquidity ratio on the balance sheet will look like this:
or by balance line codes:
How to calculate
Calculation based on balance sheet indicators can be done in two ways. The first is based on summation - fast and highly liquid property. When using the second method, all current assets are taken and inventories are subtracted from the total amount. It is believed that the latter are not highly liquid.
You can present the above in the form of formulas, denoting the quick liquidity ratio - KSL.
KSL1 = (DZ + KZD + KFV) / (KSZ + KZK + KOP), where:
- DZ – reserves in the form of cash;
- KZD - short-term debt of debtors;
- KFV – short-term financial investments;
- KSZ – short-term funds in the form of loans;
- KZK – short-term debt to creditors;
- KLP – short-term liabilities, other.
KSL2 = (OS – Zp) / OT, where:
- OS – current assets (assets) in total;
- Zp – volume of reserves;
- OT – current liabilities.
This is a “collapsed” version of the sum (KSZ + KZK + KOP) used in the previous formula.
Using the digital designations of the balance lines, we transform the formulas for using the data in calculations.
KSL1 = (p. 1230 + p. 1240 + p. 1250) / (p. 1510 + p. 1520 + p. 1550), where: p. 1250 – cash, p. 1230 – short-term accounts receivable, p. 1240 – short-term financial investments, p. 1510 – borrowed short-term funds, p. 1520 – short-term accounts payable, line 1550 – other short-term liabilities.
Note that according to 1230 reflects “receivables”, long-term and short-term. An organization can independently allocate such debt for a period of less than a year as a separate line item in the balance sheet. For example, s. 1231 or separate lines for long-term and short-term debt, respectively, 1231 and 1232.
KSL2 = (p.1200 – p.1210)/ (p.1510 +p.1520 +p.1550), where the denominator of the fraction corresponds to KSL1, and the numerator is p. 1200 – total r. 2 on current assets, p. 1210 – reserves of a legal entity.
As you can see from the formulas, the same balance sheet data is used, in one case - more detailed, and in the other - compressed. The quick liquidity ratio is calculated based on them as of a certain date and over time.
Example (data are conditional). Balance sheet indicators:
- Cash in the amount of 230 thousand rubles.
- Short-term financial investments (bill of exchange for a period of up to 12 months) – 40 thousand rubles.
- Accounts receivable for a period of up to 12 months. – 150 thousand rubles.
- Accounts payable up to 12 months. – 120 thousand rubles.
- Bank loan for up to 12 months. — 100 thousand rubles.
KSL1 = (230 thousand rubles + 40 thousand rubles + 150 thousand rubles)/ (120 thousand rubles + 100 thousand rubles) = 420/220 = 1.91.
You can calculate the coefficient at the beginning and end of the year, for several years in a row, and use the data in dynamic analysis.
Example (data are conditional). Current liabilities calculated as shown above:
- At the beginning of the year - 63 thousand rubles.
- At the end of the year - 73 thousand rubles.
Current assets in the amount:
- At the beginning of the year - 410 thousand rubles.
- At the end of the year - 420 thousand rubles.
Stock volume:
- At the beginning of the year - 85 thousand rubles.
- At the end of the year - 115 thousand rubles.
KSL2 at the beginning of the year = (410 thousand rubles - 85 thousand rubles) / 63 thousand rubles. = 325/63 = 5.16. KSL2 at the end of the year = (420 thousand rubles - 115 thousand rubles) / 73 thousand rubles. = 305/73 = 4.18.
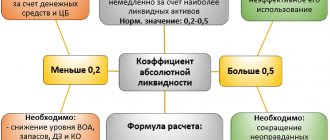
Standard value of the quick liquidity ratio
The optimal value of the coefficient is in the range of 0.7 – 1.0. Its desirable value is 1.5 if a large share of liquid assets is accounts receivable, which is difficult to collect in a timely manner. On the other hand, this ratio may be smaller if cash and cash equivalents (securities) occupy a significant share of current assets.
At the same time, the ratio of liquid funds and short-term liabilities below 1:1 indicates a high financial risk. A ratio of 1:1 indicates equality of liquid assets and short-term liabilities. But we can assume that not all assets will be sold urgently, since they have different degrees of liquidity. This means that a threat to the financial stability of the enterprise also arises in this situation.
A coefficient value of 1.4-1.5 means that the organization has a sufficient amount of free resources and is considered as the highest degree of provision of the organization with liquid resources.
General formula for calculating the coefficient
The ability of a business entity to repay obligations using quickly salable assets minus inventory reflects the quick liquidity ratio.
- Balance formula (line numbers): Ksl = (1230 + 1240 + 1250) / (1500 – 1550 – 1530). K= (term. DZ + multiple. financial investments + DS) / (term. loans) = (A1 + A2) / (Π1 + Π2).
In the calculation of this coefficient, like the previous one, reserves are not taken into account. From an economic point of view, the sale of this group of assets will bring the most losses to the enterprise. The optimal value is 1.5, the minimum is 0.8. This indicator reflects the share of liabilities that can be covered by cash flows from current activities. To increase the value of this indicator, it is necessary to increase the volume of own funds and attract long-term loans.
Analysis and assessment of the quick ratio
Using the table data, we will calculate the quick liquidity ratio of the enterprise in the past (T0) and current (T1) periods, and also analyze its dynamics:
Table 1 - Calculation of the quick liquidity ratio, thousand rubles.
| Index | T₁ | That | Change | Growth rate, % |
| Cash | 433 | 100 | 333 | 433 |
| Financial investments | 7 | 0 | 7 | X |
| Accounts receivable | 11320 | 6816 | 4504 | 166 |
| Total current assets | 11760 | 6916 | 4844 | 170 |
| Accounts payable | 7606 | 4765 | 2841 | 160 |
| Borrowed funds | 5776 | 20 | 5756 | 28880 |
| Total current liabilities | 13437 | 4835 | 8602 | 278 |
| Quick ratio | 0.88 | 1.43 | -0.56 | 61 |
The figure below shows the dynamics of changes in the indicator
An analysis of the calculated values of the quick liquidity ratio shows that last year the quick liquidity ratio was 1.43, which proves that the enterprise is provided with liquid resources, and therefore its solvency. This year, the quick liquidity ratio decreased by 0.56 points and amounted to 0.88, which indicates a threat to the financial stability of the enterprise.
Factor analysis
Having studied the dynamics of the quick liquidity ratio, it is necessary to evaluate the factors of its change. This is necessary in order to identify the main reasons for the deterioration or improvement of the financial position of the enterprise. And also justify possible options for management decisions.
One of the most widely used methods of factor analysis is the method of chain substitution. This method is universal, as it is used in all types of factor models. Factor analysis carried out using the chain substitution method is presented in the table below:
Table 2 — Factor analysis of the quick liquidity ratio
| Index | Symbol | T1 | T0 | ± | % |
| Quick ratio | KBL | 0.88 | 1.43 | -0.56 | 61 |
| Cash, thousand rubles. | DS | 433 | 100 | 333 | 433 |
| Financial investments, thousand rubles. | FV | 7 | 0 | 7 | X |
| Accounts receivable, thousand rubles. | DZ | 11320 | 6816 | 4504 | 166 |
| Borrowed funds, thousand rubles. | Kr | 5776 | 20 | 5756 | 28880 |
| Accounts payable, thousand rubles. | short circuit | 7661 | 4815 | 2846 | 159 |
| Factor calculations: | |||||
| KBL0 = (DS0+FV0+DZ0)/(Kr0+KZ0) | 1.43 | ||||
| KBLlusl1 = (DS1+FV0+DZ0)/(Kr0+KZ0) | 1.50 | ||||
| KBLlusl2 = (DS1+FV1+DZ0)/(Kr0+KZ0) | 1.50 | ||||
| KBLlusl3 = (DS1+FV1+DZ1)/(Kr0+KZ0) | 2.43 | ||||
| KBLlusl4 = (DS1+FV1+DZ1)/(Kr1+KZ0) | 1.11 | ||||
| KBL1 = (DS1+FV1+DZ1)/(Kr1+KZ1) | 0.88 | ||||
| Changing the coefficient due to: | |||||
| changes in the amount of funds: KBLlusl1 - KBL0 | 0.07 | ||||
| changes in the amount of financial investments: KBLlusl2 - KBLlusl1 | 0.00 | ||||
| changes in the amount of accounts receivable: KBLlusl3 - KBLlusl2 | 0.93 | ||||
| change in the amount of short-term loans: KBLlusl4 - KBLlusl3 | -1.32 | ||||
| changes in the amount of accounts payable: KBL1 - KBLlusl4 | -0.24 | ||||
| Balance of deviations | -0.56 |
“Accounts receivable” includes line 1230 and line 1260. “Borrowed funds” includes line 1510 and line 1540. “Accounts payable” includes line 1520 and line 1550
Thus, the quick liquidity ratio in the reporting year compared to the previous year decreased by 0.56 points and amounted to 0.88. This change was the result of the following factors:
- increase in the amount of funds +0.07
- increase in accounts receivable +0.93
- increase in the amount of short-term loans -1.32
- increase in accounts payable -0.24
Total -0.56
The figure below shows the factors of change in the analyzed indicator. The factors indicated in the yellow cells (changes in liquid assets and current liabilities) are first-order factors. The green and orange cells contain second-order factors that influence changes in liquid assets and current liabilities, respectively.
Quick liquidity ratio of T2 MOBILE LLC, comparison with Russian enterprises
The value of the coefficient may vary by industry and type of activity. Therefore, the quick liquidity indicator must be compared with similar average indicators for Russian enterprises, the industry and competitors.
The main activity of T2 MOBILE LLC is activities in the field of communications based on wireless technologies. The data for analysis was taken from the financial statements contained in the database of the Federal State Statistics Service of the Russian Federation[1]. First, let's calculate the quick liquidity ratio for T2 MOBILE LLC for 2013-2018. Then we compare the obtained data with similar indicators for Russian enterprises and the industry.
[1] https://www.gks.ru/
Table 3 - Calculation of the quick liquidity ratio of T2 MOBILE LLC, thousand rubles.
| Index | 2013 | 2014 | 2015 | 2016 | 2017 | 2018 |
| Cash | 52 | 4092 | 361240 | 261420 | 1012750 | 339186 |
| Financial investments | 0 | 90410 | 1679738 | 0 | 0 | 44519 |
| Accounts receivable | 3 | 2606096 | 18530596 | 10959253 | 8344749 | 10524571 |
| Other current assets | 0 | 167188 | 1449625 | 928035 | 1473026 | 983495 |
| Total current assets | 55 | 2867786 | 22021199 | 12148708 | 10830525 | 11891771 |
| Borrowed funds | 0 | 3820188 | 3599088 | 9122134 | 13391017 | 14617288 |
| Accounts payable | 146658 | 3543312 | 36182276 | 30565227 | 22402760 | 31099825 |
| Total current liabilities | 146658 | 7363500 | 39781364 | 39687361 | 35793777 | 45717113 |
| Quick ratio | 0.00 | 0.39 | 0.55 | 0.31 | 0.30 | 0.26 |
Now the data obtained is comparable with similar indicators for Russian enterprises and the industry. Data for calculations were taken from the database of the Federal State Statistics Service of the Russian Federation.
Table 4 - Dynamics of changes in the quick liquidity ratio for enterprises of the Russian Federation, the telecommunications industry and T2 MOBILE LLC
| Index | 2013 | 2014 | 2015 | 2016 | 2017 | 2018 |
| All enterprises of the Russian Federation | 0.97 | 0.98 | 0.99 | 1,00 | 1.02 | 1.05 |
| All industry enterprises | 1.07 | 1.06 | 1.08 | 1.14 | 1.24 | 1.28 |
| T2 MOBILE LLC | 0.00 | 0.39 | 0.55 | 0.31 | 0.30 | 0.26 |
We illustrate the data obtained in the graph:
As a result of the analysis, the following was established. The value of the quick liquidity ratio of T2 MOBILE LLC does not reach the standard value throughout the analyzed period. Moreover, in 2022 it worsened. The value of the quick liquidity ratio of T2 MOBILE LLC is worse than that of enterprises operating in this industry. The same conclusion can be drawn when comparing the company’s indicators with the average indicators for all enterprises in the Russian Federation.
Quick liquidity ratio of T2 MOBILE LLC and its closest competitors
The closest competitors of T2 MOBILE LLC are PJSC Mobile Telesystems and PJSC Vympel Communications. Let's calculate quick liquidity ratios for the listed enterprises and compare them with the liquidity and solvency of the analyzed enterprise. Data for calculations are taken from the financial statements of enterprises contained in the database of the Federal State Statistics Service of the Russian Federation.
Table 5 - Dynamics of changes in the quick liquidity ratio of T2 MOBILE LLC and its closest competitors
| Index | 2013 | 2014 | 2015 | 2016 | 2017 | 2018 |
| T2 Mobile LLC | 0.00 | 0.39 | 0.55 | 0.31 | 0.30 | 0.26 |
| PJSC Mobile Telesystems | 0.63 | 0.67 | 0.83 | 0.35 | 0.64 | 0.75 |
| PJSC "Vympel Communications" | 2.02 | 0.50 | 0.64 | 0.48 | 1.32 | 0.78 |
The analysis showed the following. The value of the quick liquidity ratio of T2 MOBILE LLC throughout the analyzed period is lower than the standard value, as well as the similar indicator of competitors. The highest value of the indicator in 2022 was for the enterprise PJSC Vympel Communications (0.78). In second place is PJSC Mobile Telesystems (0.75). For these enterprises, the coefficient value corresponds to the standard value. In third place is T2 MOBILE LLC (0.26).
Forecasting the quick liquidity ratio of T2 MOBILE LLC
Analysis of the dynamics of changes in the indicator over several reporting periods allows us to predict its further changes. The figure below shows the dynamics of changes in the quick ratio and makes a forecast based on linear regression.
The figure shows that an upward trend is emerging. At the same time, the value of the quick liquidity ratio throughout the analyzed period is much lower than the standard value.
Ways to increase the quick ratio
The following contribute to increasing the level of quick liquidity:
- increase in own working capital and increase in the provision of inventories with own working capital
- attracting long-term loans and borrowings
- justified reduction in inventory levels
- improving work with debtors
- reduction of debt to creditors
- acceleration of turnover
- control over cash balances in the cash register and bank accounts of the enterprise
Why is it needed and what does it mean?
Let’s figure out what the coefficient values obtained in the examples mean. Obviously, a higher ratio means a stronger financial position. An indicator equal to or more than 1 is currently considered normal (although some sources suggest taking a value of 0.8 as the norm).
It indicates that the value of assets that can be quickly and (or) realized soon covers the volume of the company’s current liabilities or exceeds them.
If the indicator is lower, it means that the company may not have time to pay off its current debt in a short period of time. The resulting coefficient of 1.91 indicates a strong financial position. “Fast” assets covered current liabilities almost twice.
Speaking about the obtained dynamic values of the indicator from the example, we note that they are high both at the beginning of the year and at the end, although by the end of the year there was a slight decrease (5.16 and 4.18, respectively).
Current liabilities are covered several times by the corresponding type of assets. At first glance, this is a positive factor. At the same time, a value exceeding 3 may indicate, for example, an increase in short-term accounts receivable, ineffective work of the financial service with debtors, a carelessly compiled balance sheet, or problems in the primary accounting of the company’s assets.
In addition, a large volume of funds not in circulation, but in the cash register or in accounts, indicates their slow, ineffective use. Ultimately, such financial policies reduce the company's profits.
The coefficient reduces the volume of involved credit resources, loans, obligations to counterparties for a period of less than a year. The quality of information plays a decisive role when determining the coefficient. Thus, it is unacceptable to include in the calculation bad receivables and investments in securities if their quick liquidity seems doubtful; other data on assets whose quick liquidity is questioned.
Briefly
- The quick liquidity ratio is one of the most important financial indicators of a company's performance. It is calculated as the ratio of the sum of quick and highly liquid assets to current liabilities. The calculation is carried out according to the balance sheet data.
- Depending on the purposes of the analysis, the indicator is calculated for a certain period or over time: at the beginning and end of the period; in a few years. It demonstrates how many times “fast” assets cover the company’s current liabilities.
- A value equal to or greater than one is considered positive. A value exceeding 3 may indicate inefficient use of assets, slower turnover, poor handling of accounts receivable; below 1 - the company’s high dependence on short-term loans and borrowings that are not covered by appropriate resources.