How to calculate the coverage ratio of non-current assets with equity capital?
The coefficient of provision (or coverage) with own working capital reflects the share of own working capital in all current assets of the enterprise.
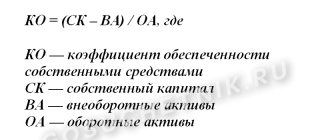
Using it, you can determine whether a given enterprise is capable of financing current activities only with its own working capital. The ratio of own working capital is defined as the ratio of the difference between the equity capital and non-current assets of an enterprise to its current assets:
Kosos = (SK – VA) / OA
All data necessary for the calculation is contained in the enterprise’s balance sheet. For the balance lines, the formula will be as follows:
Kosos = (p. 1300 – p. 1100) / p. 1200
For information on the balance sheet, articles and sections, see the material “Balance Sheet (assets and liabilities, sections, types).”
The meaning of the coefficient is that non-current assets, which are low-liquid, must be fully covered by a stable source of funds - equity capital. At the same time, some part of the capital must remain to finance the enterprise’s current activities.
For information on the liquidity of the balance sheet and its items, see the material “Analysis of Balance Sheet Liquidity.”
Asset coverage ratio with own working capital
The coefficient shows the share of own working capital (net working capital) in the total amount of financing sources and is determined by the formula:
Kpa = own working capital / amount of assets
The coefficient value must be at least 0.1.
It should be borne in mind that the rational (optimal) option for forming the finances of an enterprise is considered to be the one when fixed assets are acquired at the expense of the enterprise’s own funds and long-term loans, and working capital - ¼ at the expense of own funds and long-term loans, ¾ - at the expense of short-term loans .
Analysis of coefficient values
According to the order of the Federal Administration for Insolvency (Bankruptcy) dated August 12, 1994 No. 31-r, the normal value of the working capital ratio is higher than 0.1. Otherwise, we can talk about the likelihood of recognizing the balance sheet structure as unsatisfactory, and the enterprise itself as insolvent in the current period.
If the coefficient turns out to be negative, then all current assets, as well as part of the non-current assets, were created through loans and various loans. In this case, the stability of the enterprise will be minimal. The next section presents a separate formula for calculating the “debt” ratio.
To analyze the financial stability and solvency of an enterprise, it is also important to study the values of this security ratio over time, i.e., compare the values at the beginning of the analyzed period and at the end. If the value of the coefficient at the end of the period has increased, but remains below 0.1, this also indicates an improvement in the financial stability of the enterprise.
Calculation of solvency ratios
The financial stability of any organization is determined by its stable financial position. It is characterized by a constant excess of income over expenses, free and effective cash flow management, independence from creditors, and a low risk of bankruptcy. To assess the level of financial stability, as a rule, solvency ratios are first used. They can be represented schematically as follows:
Solvency ratios are calculated based on the balance sheet indicators as of the latest reporting date. In this case, their value is rounded to within two decimal places (clause 3, part 2, clause 5, clause 6-8 of Instruction No. 140/206).
The current liquidity ratios (K1) and the provision of own working capital (K2) calculated at the end of the reporting period are compared with their standard values depending on the main type of economic activity. The liability asset coverage ratio (K3) is compared with its standard value, which is equal to no more than 0.85 for all types of economic activity, or with a value of 1 (for leasing organizations - 1.2).
To determine the level of solvency of an organization, all three ratios must be taken into account together. In particular, an organization is recognized as solvent if the current liquidity ratio (K1) and (or) the working capital ratio (K2) have values greater than or equal to the normative ones. At the same time, the ratio of liabilities to assets (K3) is less than or equal to 1 (for leasing organizations - 1.2) (subclause 3.1, clause 3 of Resolution No. 1672).
Let us recall that four criteria have been established for assessing the solvency of organizations:
- solvent;
- insolvent;
— with insolvency becoming sustainable;
- with insolvency of a sustainable nature (clause 3 of Resolution No. 1672).
The conclusions obtained from the calculation results are used in the preparation of preliminary conclusions at the request of economic courts and information on the financial condition of the organization at the request of interested authorities (Part 1, Clause 4 of Instruction No. 140/206).
In addition, based on the results of the analysis of the financial condition and solvency of the organization, expert opinions are prepared, which are used in proceedings on cases of economic insolvency (bankruptcy) (parts 2 and 3 of paragraph 4 of Instruction No. 140/206).
You should also take into account the level of solvency of the company when deciding on the declaration and payment of dividends. After all, such a decision may turn out to be unlawful if the company has a persistent pattern of insolvency in accordance with the legislation on economic insolvency (bankruptcy) or if this character appears in this company as a result of paying dividends (Part 5 of Article 72 of the Law on Economic Companies).
The results of the calculation of coefficients are drawn up in accordance with the appendix to Instruction No. 140/206.
Let's look at an example of the procedure for calculating coefficients using data from the balance sheet of a transport organization.
| Indicator name | Balance line code | As of December 31, 2022, thousand rubles. | As of December 31, 2022, thousand rubles. |
| I. LONG-TERM ASSETS | |||
| <�…> | |||
| TOTAL for section I | 190 | 50 450 | 48 900 |
| II. SHORT-TERM ASSETS | |||
| <�…> | |||
| TOTAL for section II | 290 | 330 750 | 172 900 |
| BALANCE | 300 | 381 200 | 221 800 |
| III. EQUITY | |||
| <�…> | |||
| TOTAL for section III | 490 | 81 200 | 21 800 |
| IV. LONG TERM DUTIES | |||
| <�…> | |||
| TOTAL for section IV | 590 | 88 355 | 79 125 |
| V. SHORT-TERM LIABILITIES | |||
| <�…> | |||
| TOTAL for Section V | 690 | 176 870 | 93 460 |
| <�…> | |||
1. We calculate the current liquidity ratio (K1) using the formula :
1.1. As of 12/31/2019:
172,900 thousand rubles. / 93,460 thousand rubles = 1,85.
1.2. As of 12/31/2020:
330,750 thousand rubles. / 176,870 thousand rubles = 1,87.
2. We calculate the coefficient of provision with own working capital (K2), using the following formula:
2.1. As of 12/31/2019:
(RUB 21,800 thousand + RUB 79,125 thousand - RUB 48,900 thousand) / RUB 172,900 thousand = 0,30.
2.2. As of 12/31/2020:
(RUB 81,200 thousand + RUB 88,355 thousand - RUB 50,450 thousand) / RUB 330,750 thousand = 0,36.
3. We calculate the ratio of security of financial liabilities with assets (K3) using the formula given below:
3.1. As of 12/31/2019:
(93,460 thousand rubles + 79,125 thousand rubles) / 221,800 thousand rubles = 0,78.
3.2. As of 12/31/2020:
(RUB 176,870 thousand + RUB 88,355 thousand) / RUB 381,200 thousand = 0,70.
4. We compare the calculated coefficients with their standard values.
| N p/p | Indicator name | At the beginning of the reporting period | At the end of the reporting period | Standard value of the coefficient |
| 1 | Current ratio (K1) | 1,85 | 1,87 | K1 >>= 1.15 <*> |
| 2 | Provision ratio of own working capital (K2) | 0,30 | 0,36 | K2 >/= 0.15 <*> |
| 3 | Asset coverage ratio of liabilities (K3) | 0,78 | 0,70 | K3 </= 0,85 <**> |
| <*> Standard value of the coefficient corresponding to transport activities. <**> The standard for all types of economic activity is no more than 0.85. | ||||
In the given example, the values of the current liquidity ratio (K1) and the working capital ratio (K2) are higher than the normative ones. The value of the asset coverage ratio (K3) at the end of the year does not exceed the permissible value.
Let us recall that for the criterion for assessing the solvency of an organization, the ratio of liabilities with assets (K3) is compared with the value 1. When it is equal to or less than 1, as in our case, the organization is recognized as solvent (subclause 3.1, clause 3 of Resolution No. 1672).
Based on the analysis of these coefficients, we can conclude that the transport organization is recognized as solvent and has financial stability.
Read materials in ilex >>
Calculation of current ratio*
Calculation of the coefficient of provision with own working capital*
Calculation of the ratio of liabilities to assets*
* following the link you will be taken to the paid content of the ilex service
What does the ratio of inventory coverage with own working capital show?
This coefficient complements the picture that emerged after applying the previous two indicators. It allows you to assess whether the company has enough funds to create a sufficient amount of inventory.
To calculate the coefficient, the following formula is used:
Kozss = SK/Z,
Where:
SK – own capital of the enterprise;
Z – reserves.
If we substitute the corresponding balance sheet lines (form 1) into the formula, we get it in the following form:
Cozss = 1300/1210.
In practice, of course, the calculation is more complicated, since you have to separately find both “SK” and “Z”.
And finally, in order to make a final conclusion about the financial stability and solvency of an enterprise, it is necessary to consider the ratio of its own working capital together with the current liquidity ratio.
Gearing ratio
This ratio shows the share of borrowed funds in the total amount of financing sources.
The ratio characterizes the degree of dependence of the company on borrowed funds. It shows how many borrowed funds account for one ruble of own assets.
Kpz = borrowed capital / total assets
Accordingly, the value of this indicator should be less than 0.5. The higher this ratio, the more loans the company has and the riskier the situation, which can ultimately lead to the insolvency of the enterprise.
Values of the obtained coefficient
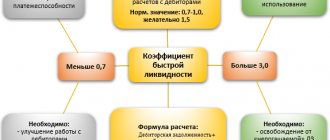
The higher the coefficient, the higher the solvency of the subject and financial stability. However, a very high rate is not an unambiguously positive sign. An increased ratio means that liquid assets are being used ineffectively. It indicates that the company has a lot of reserves (money in current accounts, short-term financial deposits, accounts receivable), but they do not work. Let's consider all coefficient values:
| Coefficient value | Financial position of the company |
| Ratio less than 2 | The company is having problems paying off its long-term and short-term liabilities. Increased risk of bankruptcy. |
| Coefficient greater than 2 and less than 3 | Average solvency of the subject. Good ratio of assets and liabilities. Low bankruptcy rate. |
| Coefficient greater than 3 | Average solvency of the subject. Good ratio of assets and liabilities. Low bankruptcy rate. |
This is the most approximate decoding of the coefficients. The exact one depends on the specifics of the enterprise’s activities. For comparison, you can pay attention to the industry averages. It also makes sense to conduct analysis over time. That is, the coverage ratio must be calculated regularly, and then current and previous indicators must be compared.
REFERENCE! The coverage ratio does not fully reflect the performance of the enterprise. For a complete analysis, it is also necessary to determine liquidity and solvency ratios.
FOR YOUR INFORMATION! The optimal value for different industries is considered to be from 1.5 to 2.5. This value varies depending on the industry, market conditions and other indicators.