An industrial enterprise, trading company or other economic entity can be compared to a mechanism, complex in its design and no less complex in management.
Operational control tools can help in complex management, without which it will only be possible to state after the fact that the business is “going in the wrong direction.” One of these tools is the analysis of capital turnover, by consulting which you can make a correct forecast about the results of the enterprise’s activities and adjust the course of development in a timely manner.
What will we analyze?
From the point of view of the movement of inventory assets (that is, inventory turnover), an industrial enterprise takes raw materials, produces finished products and ships them to the buyer. Then everything is repeated. This is a production cycle; it has the characteristic “Duration”, which is measured in units of time.
In terms of cash flow, an industrial enterprise takes the money it has at its disposal and uses it to pay for raw materials. The money is then returned (usually at a profit) as payment for the finished product. This is a financial cycle; it also has the “Duration” characteristic, which is measured in units of time. The period of time between the shipment of products to the buyer and receipt of payment for these products from him is called the “Accounts Receivable Turnover Period.”
These events can occur at different times relative to each other. The duration from the very first event to the very last is the operating cycle. If an enterprise pays a supplier for raw materials on a deferred basis, and it also provides a deferred payment to the buyer, then the production, financial and operating cycles look like this:
Fig.1 Scheme of cycles in time
The shorter the cycle, the better. But is the duration of the cycle sufficient for its comprehensive characterization? Based on duration alone, it is impossible to understand what volumes of inventory or what volume of accounts receivable we are talking about. In addition, many production chains exist simultaneously with different durations for different products.
Also, for the characteristics of inventory turnover and accounts receivable turnover, the turnover volume indicator alone is not enough. For example, from data such as “Buyers owe X rubles”, and “Inventories of goods and materials in the warehouse amount to Y units of accounting in the amount of Z rubles”, it is impossible to understand what scale of production activity we are talking about.
Inventory of goods and materials in the amount of Y may be excessive for a small enterprise and completely normal for a large one. Accounts receivable in the amount of X is normal for a large company and dangerous for a small one. Therefore, when introducing an indicator characterizing a particular turnover, it is customary to correlate it with the sales of the enterprise. In other words, when analyzing different enterprises or when changing the scale of activity of one enterprise (crisis, growth, increase in branches, seasonal ups and downs), it is important to understand whether the correct proportions of various turnover indicators are maintained.
Free consultation on financial automation. accounting
We will answer all your questions and select a solution for any industry and size of business.
Find out more
Automation of financial analysis and management
Analytical reports, convenient dashboards, minimal cost of implementation and ownership of the system
Learn more
Turnover ratios
The turnover ratio of a certain entity characterizes the ratio of sales to the size of the entity. Using this formula you can calculate the turnover ratio of anything:
Turnover ratio = Sales for the period ——————————————————— Turnover entity for the period
When using this formula, it is important to pay attention to a number of nuances.
The dimension of the turnover ratio is dimensionless (scalar). In standard solutions on the 1C platform, you can see that it is measured in Revolutions, but this is some freedom of the developers.
Sales for a period can be either Revenue or Cost of Sales, depending on the turnover entity and ratio. If we are talking about revenue, then it makes no sense to include VAT in the revenue amount, since this is not the money of the enterprise itself. For the same reason, it makes no sense to include excise taxes in the amount of revenue. Thus, in the income statement of sale:
- or Revenue (excluding VAT and excise taxes) – line 2110 in form No. 2;
- or Cost of sales – line 2120 in form No. 2.
The turnover entity for the period , if it is a cost (for example, inventory), is correlated with Sales at cost. In other cases, it is correlated with Revenue.
The period for the numerator and denominator must be the same.
How to calculate the turnover of an entity for a period if it changes every day (for example, the balance of inventory)? One simple (and incorrect) option is to average the value of the entity being wrapped. To do this, textbooks and popular articles on the Internet suggest calculating the average of two extreme values - at the beginning of the period and at its end:
For a long period (for example, a quarter, a year), the method of averaging over two extreme values is a significant problem, because this can significantly impact your turnover ratio. Therefore, it is worth using not averaging over two extreme values (far from reality), but more accurate methods for estimating a variable (or distributed over a time interval) value.
Range of values. In a formula, neither the numerator nor the denominator can be less than zero. Consequently, the turnover ratio can only take positive values (and zero) in the described methodology. At the same time, the query “negative turnover ratio” still appears in Internet search engines. This can happen with certain methods (which should be avoided) for calculating the turnover ratio. In addition, the case cannot be ruled out when the coefficient can go to infinity. These cases will be mentioned in the section “Accounts Payable Turnover Ratio”.
Interpretation. The higher the ratio, the higher the turnover (a positive sign) or the greater the return on investment (also a positive sign), with the exception of the accounts payable turnover ratio, where the opposite is true.
Working capital and their financial analysis
Analysts consider working capital turnover indicators in a comprehensive manner. The turnover ratio is a value that shows the speed of turnover, the intensity of use of certain assets or liabilities, and the business activity of the company.
How to calculate the inventory turnover ratio ?
In relation to working capital, also called current assets, the turnover rate is calculated:
- current assets;
- stocks;
- accounts receivable, etc.
On a note! In financial analysis, the calculation of total asset turnover ratios and equity capital is also often used.
Inventories and accounts receivable are included in current assets. Calculation of their turnover is a special case of the working capital turnover ratio.
To determine the working capital turnover ratio, it is necessary to divide revenue by their value.
Working capital is taken according to the average annual balance: the value at the beginning of the year is plused with the final annual value and divided by 2. Taking data only at the beginning or end of the year is incorrect - a significant error in the calculations is created.
How to calculate the accounts receivable turnover ratio ?
The ratio is the basis for other important analytical indicators for working capital. For example, their turnover in days can be calculated by dividing the number of days in the period by the turnover ratio. If the production cycle is not interrupted, the enterprise operates continuously, 365 days are taken, in other cases it is customary to deduct weekends.
The result will show how many days the company will receive the same revenue as the amount of working capital, i.e., in other words, after what period of time the company will see investments in current assets in the form of revenue and recoup them.
It is also popular to calculate the indicator inverse to the turnover ratio, when current assets are divided by revenue for the period. This is the so-called utilization rate of funds in circulation. It shows how much working capital was invested to generate 1 ruble of revenue. The lower the value, the better the use of working capital. To correctly reflect the indicator, it is converted into kopecks - the value is multiplied by 100.
Accounts payable turnover
To calculate the accounts payable turnover ratio, it would seem logical to take the cost of purchases instead of the cost of sales. However, such an indicator would not answer the question: “To what extent does the dynamics of changes in accounts payable correspond to the economic activity of the enterprise and its scale?” At the same time, scale is associated precisely with sales, and not with purchases. In addition, since there is no purchase indicator in the balance sheet, it is necessary to use indirect assessment methods of the form:
This method can lead to negative values of the coefficient and the need for its correct interpretation in financial analysis. Therefore, the dynamics of accounts payable are most often (and rightly so) still correlated with sales, and not with purchases. In this case, you cannot use the proceeds, because then an increase in the trade margin would increase the accounts payable turnover ratio, whereas an increase in the trade margin should not affect this ratio. Therefore, it is necessary to use the cost of sales:
It is convenient to take the balance of accounts payable at the beginning and end of the period from line 1520 of form No. 1 (balance sheet). There is no standard value for the accounts payable turnover ratio. If we work with suppliers on an advance payment basis, the accounts payable turnover ratio will go to infinity. If there are also no sales, the turnover ratio will be uncertain (zero to zero).
Analysis of profitability of organizations
The financial and economic activities of any legal entity, regardless of the form of ownership, are assessed by analyzing the absolute and relative indicators of its activities. The indicators of the first group do not carry an economic burden and are purely arithmetic in nature.
Relative indicators characterize how well the financial and economic activities of an enterprise are organized and show the dynamics of its development. One such indicator is return on assets, which is calculated by multiplying the asset turnover ratio by the return on products sold.
Profitability of products sold is the ratio of net profit to revenue, and net profit in turn is the difference between revenue received and cost of goods sold.
Thus, the higher the capital productivity ratio, the greater the organization’s profit in the reporting period.
We analyze the results obtained
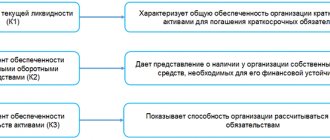
To calculate how much profit an organization will receive from each monetary unit invested in its assets, the net profit from sales of products should be divided by the average value of existing assets (property):
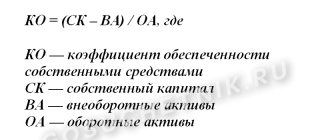
Ra = PE / SAsr, where
Ra – return on assets, PP – net profit, SAsr – average value of assets.
The return on current assets is calculated in the same way.
In order to make a complete analysis of the enterprise’s activities, all groups of factors must be taken into account: capital productivity, return on sales, intensity of OS operation, efficiency of financial management. Constant monitoring of the enterprise’s activities will allow us to develop the right development strategy aimed at ensuring financial stability. The completeness of the analysis of business activity also depends on the correctness of the data provided in the reporting documentation.
Top
Write your question in the form below
Inventory turnover
As in the previous case, when calculating the inventory turnover ratio, instead of Revenue, you must use Cost of Sales:
It is convenient to take the balance of inventories at the beginning and end of the period from line 1210 of form No. 1 (balance sheet). There is no standard value for the inventory turnover ratio.
There is an opinion that there are two formulas for inventory turnover, that is, you can also use Revenue instead of Cost of Sales. You shouldn't do that. This coefficient characterizes the speed of passage of goods and materials through the warehouse, and it should not depend on profitability standards, which, for example, may have a pronounced seasonality.
Asset turnover ratio. Calculation formula
Take our proprietary course on choosing stocks on the stock market → training course
The formula for calculating asset turnover is as follows:
To calculate the “Average annual value of assets”, you need to add the value of assets at the beginning of the year and at the end of the year and divide by 2.
According to the balance sheet forms, the indicator is calculated using the formula:
Asset turnover ratio = line 2110/(line 1600ng.+line 1600kg/2)
Ng. – line value 1600 at the beginning of the year. Kg. – line value 1600 at the end of the year.
Don't forget to also divide by 2 to find the average asset value for the year. The reporting period may not be a year, but a month.
How to calculate everything correctly and get incorrect results
Often, financial directors themselves calculate the listed indicators in Excel, since this is a “handy” option for obtaining them. Using the accounts receivable turnover ratio as an example, we will illustrate some (not all) of the problems of this approach.
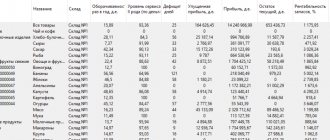
Fig. 2 Calculation example from a popular site
The Odz receivables turnover ratio for the 4th quarter (and, as a consequence, for the year) was calculated incorrectly. The receivables turnover period, measured in days, is erroneously called the average balance of receivables “SO dz, days” and is also incorrectly calculated for the 4th quarter (and, as a consequence, for the year).
Let's correct the numbers and names:
Original option No. 1
We also provide formulas for columns of an Excel smart table (not for cells):
- KO DZ=[@Revenue]/[@[DZ avg]]
- ON DZ=1/[@[KO DZ]]*[@Days]
Now let’s make changes to the data for the first quarter and see how the turnover indicators change. Let's leave the revenue the same (RUB 1,200 thousand). We will increase the balance of accounts receivable at the beginning of the period by 100 thousand rubles. (up to 750 thousand rubles) To ensure that the average accounts receivable for the first quarter does not change, the balance of accounts receivable at the end of the period will be reduced by 100 thousand rubles. (up to 250 thousand rubles) Let's analyze the turnover of receivables.
Changed and changed cells are highlighted with fill:
Modified version No. 1
Compared to the original version No. 1, in the modified version No. 1 the enterprise performed much better in the first quarter. Managers monitoring the financial discipline of buyers managed to significantly reduce the amount of accounts receivable from 750 thousand rubles. up to 250 thousand rubles. (in the original version No. 1, they worked worse and reduced the debt by only 300 thousand rubles from 650 thousand rubles to 350 thousand rubles). But this did not in any way affect the accounts receivable turnover ratio of 2.40 in the first quarter, since the average value of accounts receivable for the quarter did not change - 500 thousand rubles, and revenue did not change - 1200 thousand rubles.
Compared to the original version No. 1, in the modified version No. 1 the enterprise performed much worse in the second quarter. It significantly increased the debt of buyers (from 250 thousand rubles to 987 thousand rubles). But paradoxically, the accounts receivable turnover ratio increased from 2.02 to 2.18
This can be explained, for example, by the dismissal of responsible managers from the first quarter (the task was set to reduce debt, but the receivables turnover ratio did not show this decrease), and the bonuses given to the irresponsible ones who replaced them in the second (the receivables turnover ratio increased, but it influences wages). That is, the coefficient increased not because of good work in the second quarter, but because of the indicators of the first quarter and the peculiarities of calculating the coefficient.
Now let's look at the annual figures. In the modified version No. 1, the enterprise reduced its debt more during the year (from 750 thousand rubles to 586 thousand rubles) than in the original version No. 1. But the accounts receivable turnover ratio worsened and became 8.77 instead of 9.49.
Why did it happen?
- The previously cited academic formula for the receivables turnover ratio is deaf to the dynamics of changes in receivables (it does not care whether it increases or decreases);
- The ending balance of receivables greatly influences the receivables turnover ratio of the next time period, and in the wrong direction. And the academic formula is sensitive to the initial remainder;
- The specific value of the balance of accounts receivable on the single day of the beginning of a long period extremely poorly characterizes the turnover of accounts receivable throughout the year, but has a very good effect on the annual turnover ratio.
In other words, the turnover ratio formula is sensitive to two days and completely deaf to everything in between. If we more accurately estimate the average accounts receivable balance for the year, for example, manually enter the average value (average accounts receivable balances by quarter) in the “Receivables of average” cells in the “Year” line – 654 thousand rubles. and 642 thousand rubles, we will receive confirmation that the enterprise performed better for the year as a whole: the annual turnover ratio increased from 8.84 to 9.00, and the annual receivables turnover period decreased from 41.43 to 40.5 days ( two tables below).
Original option No. 2
Modified version No. 2
Although changing the algorithm for calculating the average balance of receivables solves the problem with the annual receivables turnover ratio, the calculations presented above for the indicators are very far from reality and do not solve the problem of the second quarter, since a full-fledged financial analysis is impossible without special algorithms and software tools.
Monitoring turnover indicators using specialized software solutions
Interpretation of turnover ratios by entering indicators into Excel and calculating coefficients using the academic formulas described above will most likely lead to incorrect estimates of turnover and, as a result, to incorrect management decisions. Financial analysis requires software that calculates indicators in a complex manner, taking into account a larger number of indicator measurement points and other features. Next, we will look at examples of working with turnover indicators within the framework of financial management based on 1C, which can also be read on our website.
We will select a free program for automating financial accounting based on 1C
Inventory turnover report in 1C:ERP
In the standard configuration of 1C:ERP Enterprise Management 2 (2.4.11.63) there is a special report “Inventory turnover”. Please note that in the report settings, the columns with the ratio and turnover period can be turned off. Please also note that the report setting option “Exclude days out of stock” indicates a complex algorithm for estimating inventory levels, and not a simplified averaging over extreme values, as suggested in academic formulas. The structure of the report is shown below.
Analysis of fixed asset turnover using the budgeting subsystem in 1C:ERP
Despite the absence of turnover standards, the report calculates the standard turnover based on inventory supply parameters. The report allows you to:
- Determine warehouses, types of items, warehouse groups and price groups with the lowest turnover;
- Identify product items with turnover below the established norm;
- Determine the dynamics of the turnover ratio in comparison with the previous period and the same period last year;
- Assess current balances and inventory levels for goods of interest.
Fig. 3 Inventory turnover in 1C:ERP
Asset turnover
Definition
Asset turnover
(asset turnover) is a financial indicator of the intensity of use by an organization of the entire set of available assets. This indicator is used along with other turnover indicators, such as accounts receivable turnover, accounts payable turnover, inventory turnover, to analyze the effectiveness of managing the company's property and liabilities.
Calculation (formula)
Asset turnover (ratio) = Revenue / Average annual value of assets
Asset turnover (in days) = 365 / Asset turnover ratio
Data on revenue can be obtained from the “Profit and Loss Statement”, data on the value of assets can be obtained from the Balance Sheet (balance sheet). To calculate the average annual value of assets, find their amount at the beginning and end of the year and divide by 2.
Normal value
There is no specific standard for turnover indicators, since they depend on the industry characteristics of the organization of production. In capital-intensive industries, asset turnover will be lower than in trade or services.
Higher asset turnover is desirable. Low turnover may indicate insufficient efficiency in the use of assets. In addition, turnover depends on the rate of return on sales. When profitability is high, asset turnover is usually lower, and when profitability is low, it is higher.
It should be noted that, unlike the indicator “return on assets”, where the numerator is profit, asset turnover does not give an idea of the profitability of the activity (i.e. the indicator will have a positive value even if there are losses).
For investors and business owners, another profitability indicator is of great value - return on equity.
Read about asset turnover in English in the article “Asset Turnover”.
Monitor of target indicators in 1C:ERP
Another 1C:ERP tool for monitoring and analyzing target performance indicators of an enterprise. Not only the indicator values are available for analysis, but also the degree to which the goals have been achieved. The configuration comes with 20 pre-configured indicators; it is possible to add and configure custom indicators. When viewing, it is possible to select indicators by monitoring frequency and condition. The monitor has a special mode (Alt-D), which allows you to get acquainted with its capabilities without spoiling anything.
Fig.4 Monitoring target indicators
For each indicator, you can get more detailed information using the “Indicator Analysis” menu.
Fig.5 Clarification of the indicator
You can read about other financial analysis and planning tools in 1C on our website.
Monitoring turnover indicators using 1C:UH
In the standard configuration of 1C: Holding Management, edition 3.1 (3.1.1.15), just like in 1C:ERP, there is a report “Inventory turnover in warehouses”.
Analysis of fixed asset turnover using the budgeting subsystem and analytical reports in 1C:UH
Additionally, there is a “Key Indicators Monitor”. The monitor presents absolute values of indicators. They can be detailed by clicking on the indicator hyperlink.
Fig.6 Monitoring tools in 1C:UH
We calculate the turnover period of current assets (OA): basic formulas
The turnover period of current assets is an indicator that reflects the period during which a company’s investments in OA will return to it. This indicator is generally calculated using the formula:
PO = PERIOD / (B / OA),
PO - OA turnover period;
PERIOD — duration of the analyzed period in days;
B - revenue for the analyzed period;
OA is the average balance of OA for the analyzed period.
If the analyzed period is 1 year (PERIOD is 365 days), indicator B will be equal to the value in line 2110 of the company’s annual income statement. The OA indicator will be the average value between the values in line 1200 of the balance sheet as of the beginning and end of the year. The OA turnover period shows the time required to replace the enterprise's working capital with received revenue.
This indicator is directly related to the OA turnover ratio, which is determined by the formula:
KO - turnover ratio of OA;
B, OA - the same indicators as used in the previous formula.
The coefficient under consideration shows how many turnovers (returns of each ruble invested in the turnover of assets classified as current) are carried out within the framework of the production process during the analyzed period. In fact, the higher the corresponding ratio, the shorter the asset turnover period will be, and vice versa.
If the analyzed period is 1 year, then the source of data for calculating the CR indicator, as in the case of the previous indicator, can be the enterprise’s balance sheet, as well as the financial performance statement.
Let us now consider what significance the OA turnover period (and the accompanying coefficient) can have when assessing the results of an enterprise’s economic activities.
Monitoring turnover indicators using WA: Financier. Monitoring indicators on the dashboard
The WA: Financier configuration, developed on the basis of the 1C: Enterprise platform, provides a comprehensive arsenal of tools for analyzing key indicators.
Fig.7 Manager's monitor in WA: Financier
Calculation of turnover ratios is possible through the custom reporting mechanism.
Fig.8 Customized custom turnover report in WA: Financier
The use of dashboards allows you to visualize the results obtained, which will simplify their understanding by management and interested managers.
Monitoring fixed asset turnover indicators using WA: Financier dashboards
Economic sense
Turnover ratio is a value that reflects the degree of intensity of use of a certain share or all resources as a whole. It shows how many cycles “money - products - money” (turnovers) the assets made at a certain point in time .
Traditionally, calculations are made for a period equal to the average month (30 days), quarter (90 days), half a year and year. Analysis and assessment of turnover dynamics are necessary to maintain a balance between the structural components of the enterprise's funds. They make it possible to partially predict the result of economic activity and determine the need for certain types of resources and capital.
An increase in the turnover rate is a signal of an increase in business activity and solvency of a business entity. Consistently positive dynamics characterize the enterprise as smoothly operating and resistant to market fluctuations.
Decisions and results based on analysis
On our website you can read an article about how to build budgeting and what advantages it will give. But even a single analysis tool will allow you to make a number of correct management decisions:
- Unification, centralization of the procurement process to reduce downtime due to shortages of raw materials/materials, optimize logistics with the supplier and obtain wholesale discounts.
- Implementation of inventory management process, ABC-XYZ analysis, renewal policies for different inventory groups to reduce stored inventory and reduce downtime due to shortage of raw materials/supplies.
- Investments in capital goods to reduce the turnover period of work in progress.
- Reducing the turnover period of finished products to rationalize the production of batches and eliminate the storage of finished products, as well as to optimize logistics to the buyer.
- Changing contractual terms with suppliers and customers to reduce production and financial cycles, as well as periods of circulation of accounts payable and receivable.
- Implementation of cash flow management policies using a payment calendar to implement planning and eliminate cash gaps.
Based on the briefly listed possibilities, we can conclude that analysis of turnover indicators is an effective mechanism for maximizing profits that does not require the involvement of additional material and monetary resources. It shows the points of effort to improve the efficiency of the enterprise. Analysis of indicators requires specialized software, its configuration or modification to the specifics of the enterprise by IT specialists.
We will offer a wide selection of technical solutions for automating financial analysis and accounting
Normal values
Industry characteristics and the individual specifics of a company’s business do not allow us to formulate standard indicators for any of the turnover ratios described in the article. For example, a trading enterprise will obviously have a cash turnover higher than a capital-intensive enterprise. However, using the formulas given in this article, we will calculate the turnover ratios for some enterprises according to their financial statements, available on the website of the Federal State Statistics Service:
These examples prove that turnover ratios fluctuate quite strongly, so it makes no sense for an enterprise to rely on an external “normal value”, but rather to develop its own, taking into account the industry and the specifics of the business.