The main reasons for the reduction of inventories (the negative role of inventories)
The main reason prompting enterprises to reduce inventories is the costs associated with their storage, which for the year amount, as noted in § 17.1, to approximately 25% of the value of the inventory.
Let's consider what types of costs can be reduced by reducing inventories.
Reducing inventories allows you to reduce losses from necrosis in cash reserves. Investing money in reserves means withdrawing them from alternative projects and, accordingly, losing profit from the implementation of these projects. The amount of lost profit is assessed by the rate of efficiency of cash investments in working capital. The lower limit of this norm can, for example, be considered the Sberbank interest rate on household deposits. Obviously, the size of losses from the death of funds will be directly proportional to the size of the reserve. Moreover, the coefficient of proportionality is the capital efficiency rate.
Reducing inventories allows you to reduce the cost of maintaining specially equipped premises - warehouses. Storage of products requires the creation of appropriate conditions.
For this purpose, warehouses are created, which, as a rule, are buildings or premises equipped with all the necessary equipment. The costs of maintaining a warehouse include depreciation on its cost, as well as expenses such as heating, security, electricity, etc.
Reducing inventories allows you to reduce labor costs for warehouse personnel: administrative and managerial workers, storekeepers, drivers of in-warehouse vehicles, loaders, forwarders, etc.
Reducing inventories allows you to reduce losses from deterioration in consumer quality of products. Storage of products is often accompanied by a change in their consumer qualities, either due to ongoing physical and chemical processes, or due to obsolescence of the product. Obsolescence leads to depreciation and, accordingly, to costs.
Physico-chemical processes that occur with products during storage can sometimes increase their cost. For example, when certain types of wine are stored, their quality increases. However, most often the physical and chemical changes that occur during storage lead to a decrease in the consumer qualities of the product and, accordingly, to costs that will be directly proportional to the size of the inventory.
Reducing inventories allows you to reduce losses caused by the risk of theft, fires, and natural disasters. The cost of risk in monetary terms can be assessed:
- o through insurance costs;
- o through the tariffs and rates of insurance companies.
As you know, the best protection against theft is the absence of products. It is obvious that losses caused by the risk of theft, fires, and natural disasters are directly proportional to the size of reserves.
Formula for determining working capital
First of all, any company needs to understand exactly how much working capital it needs for stable and efficient operation. To do this, use the formula:
P = Z + Dz – Ko, where
P – financial and operational need for working capital;
Z – inventories and other current assets;
Dz – accounts receivable;
Co – short-term liabilities.
To determine each of the indicators, one of the possible methods is used:
- Experimental and statistical. It is necessary to analyze statistical data for several years (usually from 3 to 5). Based on this information, calculate average indicators and use them to determine the enterprise's need for working capital.
- Direct calculation. First, a system of standards is developed for each item of current assets. This is a complex job that requires a thorough analysis of the production process, taking into account the seasonality of production, possible changes in market conditions and a number of other factors.
- Coefficient method. It differs from the direct calculation method in that it uses a system of correction factors that reflect the planned dynamics of changes in production rates.
Production assets are subject to mandatory rationing: stocks of raw materials and supplies, as well as finished products. Circulation funds - accounts receivable, money and financial investments, as a rule, are not standardized. Their dynamics are adjusted taking into account the current financial position of the enterprise, market conditions, the state of financial markets, etc.
The basis of the analysis of working capital is the calculation and evaluation of the system of coefficients. They show whether current assets are sufficient for an uninterrupted production process, from what sources they were formed, and how effectively they are used.
The main reasons for creating inventories (the positive role of inventories)
Maintaining inventories is always associated with costs, but entrepreneurs are forced to create them, since the lack of inventories can lead to an even greater loss of profit.
Let's consider the main reasons that guide entrepreneurs when creating inventories.
Increasing inventory leads to increased ability to serve customers immediately. You can complete a customer order in one of the following ways:
- o at a manufacturing enterprise - produce the ordered goods;
- o at a trading enterprise - purchase the ordered goods;
- o in both manufacturing and retail enterprises - issue the ordered goods immediately from the available stock.
The last method is, as a rule, the most expensive, since it requires maintaining a reserve. However, in a competitive environment, the ability to immediately satisfy an order can be decisive in the fight for the consumer.
Thus, a decrease in inventory may lead to losses due to decreased sales.
Increasing inventory leads to lower costs associated with placing orders.
An increase in inventory leads to a decrease in the number of orders, as orders are placed less frequently but become larger. A reduction in the number of orders, in turn, leads to a reduction in the costs associated with placing them.
Each order sent to a supplier is associated with certain costs. It is necessary to make a decision about sending an order, then place an order, make the appropriate payments, monitor the supplier’s compliance with the terms of the contract for this order, accept the goods, and possibly file a claim upon completion of the order. The above list of works, which is not complete, indicates that an increase in the number of orders increases the labor costs of employees of the supply department, warehouse, accounting, and other departments of the enterprise. An increase in labor costs entails an increase in the number of employees with a corresponding increase in wages. The need for office space and equipment is increasing, which also increases costs.
Paper consumption, phone calls and email costs increase. The list of types of costs that increase with an increase in the number of orders can be continued.
Thus, an increase in inventory leads to a decrease in the costs associated with placing orders.
Increasing inventories leads to lower costs associated with product delivery.
Increasing the size of the delivered consignment of goods in some cases makes it possible to switch from small-tonnage road transport to large-tonnage or railway transport, which, in turn, reduces the total transport costs per unit of time. For example, a wholesale trade company has set a sales plan for copier paper of 16,000 packages per month. Delivery can be carried out by wagon - one wagon per month, or by car - two cars per month. Using a wagon allows you to save on delivery, but doubles the average stock in the warehouse.
Thus, increasing inventory can lead to lower transportation costs.
Increasing inventories (sales) allows you to reduce costs associated with the production of a unit of product. Products can be produced in small batches as demand arises. Then the inventories will be small, but constant production readjustments will put a burden on the unit cost of the product. Another way is to release one large batch and keep the finished product in sales inventory. In this case, the costs associated with launching a product into production will be spread over a large number of products, which can reduce the unit cost even with increased inventory.
Thus, increasing the sales inventory by increasing the size of the produced batch of products reduces the cost of their production.
An increase in inventories increases the enterprise's ability to withstand violations of the established delivery schedule (unpredictable decrease in the intensity of the input material flow). We are talking about a safety stock, which is created so that in the event of a delay in deliveries, the production or trading process does not stop.
Thus, an increase in inventory leads to a reduction in the risk of losses from production stoppages or lack of goods in trade.
Increasing inventories increases the enterprise's ability to withstand fluctuations in demand (an unpredictable decrease in the intensity of the output material flow). We are also talking about safety stock. Demand for a product is subject to fluctuations that cannot always be accurately predicted. Therefore, if you do not have a sufficient safety stock, a situation cannot be ruled out when effective demand will not be satisfied, i.e. the entrepreneur risks being left without the goods at the moment of demand and letting the client go with money and without a purchase.
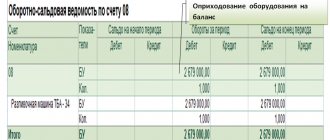
An increase in fixed assets on the balance sheet indicates
Financial management General assessment of the dynamics and structure of balance sheet items The structure of non-current assets during the analyzed period has changed significantly, although at the same time the bulk of the enterprise's non-current assets are fixed assets. The largest part of non-current assets is represented by production fixed assets and unfinished construction, which characterizes the enterprise's orientation towards creating material conditions for expanding the main activities of the enterprise.
The emergence of long-term financial investments reflects the financial and investment development strategy. Current assets. The current assets of the enterprise during the analyzed period increased by thousand. The increase in current assets was due to an increase in short-term receivables, inventories, long-term receivables of other current assets, cash and VAT. The structure of the enterprise's current assets as part of property during the analyzed period remained quite stable.
The decrease in the level of inventories in the structure of current assets cannot be judged by the enterprise (discussed earlier); there was a decrease in the share of inventories in the Availability of such materials indicates that working capital.
An increase in current assets indicates different trends in the financial and economic activities of an enterprise. To give a correct assessment of this phenomenon, it is necessary to consider the influence of each element included in the structure of current assets. We will tell you what you should pay attention to in this article.
What does an increase in current assets show?
What does a decrease (reduction) in current assets indicate?
Every organization needs to have property to conduct commercial activities. These material assets can be either their own, that is, created or acquired by the company independently, or attracted, that is, entered into the organization from the outside.
The company's property is usually called assets and is divided into current and non-current. Each category has certain characteristics.
Let's consider what current assets are, as well as what an actual increase in the value of this indicator over time may indicate.
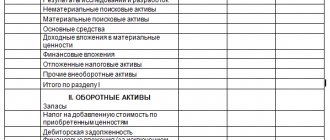
Assets must be reflected in the company's balance sheet. This reporting document allows you to generate information about the financial condition of the organization at the end of the calendar year. The first section of the balance sheet is used to reflect data on non-current property, which is characterized by the following properties:
- Long period of use (more than 12 months or more than one production cycle if its duration exceeds one year).
- High cost of acquisition or production.
- The ability to write off value by calculating depreciation using one of the methods permitted by law.
- Low level of liquidity (accordingly, it will take considerable time to convert into cash equivalent).
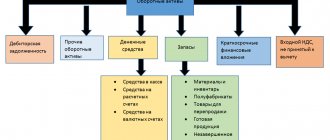
Unlike non-current assets, current assets have completely opposite properties. Their main characteristic is a significant level of mobility. This means that this category of values forms the basis of the company’s production process, as it allows for its continuity.
The composition of current assets is quite diverse. In this regard, various classifiers are provided, which, based on certain characteristics, make it possible to generalize assets into groups. In general, current assets include inventories, manufactured products, cash and receivables of the company.
Tangible current assets are
In order to obtain information about the financial condition of an organization, it is not enough to have dry values of economic indicators. It is necessary to consider their values in dynamics and carry out appropriate analytical measures.
The existence of a large number of types of working capital makes it possible to use the value of this indicator in dynamics to carry out a number of analytical activities, which allows:
- Assess the operating efficiency of the company, namely, determine its level of profitability.
- Calculate the organization’s financial stability indicators.
- Possible attractiveness, as well as possible risks for potential investors.
- Determine the company's business activity indicators.
Each economic indicator of an organization’s activity should be considered by specialists in dynamics, since a static value does not carry the necessary information.
A reduction or increase in current assets indicates, first of all, that the company’s activities have undergone changes. In order for the company to have resources in the required quantity, it is advisable to use methods of rationing current assets.
What can an increase in the amount of working capital indicate? First of all, an increase in current assets indicates that the company is using available material resources irrationally and allows for a decrease in asset turnover.
Also, often an increase in this indicator may indicate that the sales department is not working effectively enough. However, the organization does not always increase the indicators of current assets in a negative way.
Let's say it is planned to expand production, which will require raising additional funds. The company can obtain the necessary resources from additional sources, or it can work for some time in accumulation mode.
Thus, an increase in working capital indicates a possible increase in production.
Very often, balance sheet data indicates a decrease in the value of non-current assets. It should be remembered that they are formed mainly from depreciable property and the balance sheet shows its residual value (less depreciation).
Therefore, for example, a decrease in the value of fixed assets may be due not only to the disposal of obsolete or unnecessary fixed assets, but also to the accrual of depreciation.
13 An increase in fixed assets indicates an expansion of the enterprise’s production base and is assessed positively if it is not related to the results of their revaluation (see Table 7).
The presence of intangible assets in the organization’s property indirectly characterizes the strategy chosen by the organization as innovative, since the company invests in patents and other intellectual property.
Attention The main reason that prompts enterprises to reduce inventories is the costs associated with their storage, which for the year amount, as noted in § 17.1, to approximately 25% of the value of the inventory. Let's consider what types of costs can be reduced by reducing inventories.
Reducing inventories allows you to reduce losses from necrosis in cash reserves. Investing money in reserves means withdrawing them from alternative projects and, accordingly, losing profit from the implementation of these projects.
The amount of lost profit is assessed by the rate of efficiency of cash investments in working capital. The lower limit of this norm can, for example, be considered the Sberbank interest rate on household deposits.
Obviously, the size of losses from the death of funds will be directly proportional to the size of the reserve. Moreover, the coefficient of proportionality is the capital efficiency rate.
- The growth rate of the balance sheet currency is higher than the inflation rate, but not higher than the growth rate of revenue.
- The sizes, shares and growth rates of receivables and payables are approximately the same.
- The growth rate of current assets is higher than the growth rate of non-current assets and short-term liabilities.
- The size and growth rate of long-term sources of financing (equity and long-term debt capital) exceed the corresponding indicators for non-current assets.
- The share of equity in the balance sheet currency exceeds 50%.
- There are no uncovered losses on the balance sheet.
- Assessing the results of balance sheet analysis Current Assets An increase in the share of current assets helps to mobilize assets and accelerate the turnover of the company's funds.
On the contrary, an increase in capital due to the results of the revaluation does not indicate the real development of the organization. The growth of additional capital indicates the receipt of allocations from the budget to finance capital investments. It may also increase due to the receipt of share premium if there is an increase in the authorized capital of the organization.
The most important and mobile source of replenishment of equity capital is retained earnings, which can be considered as the main source of self-financing of activities, used to replenish working capital (stocks of raw materials and supplies), modernize production (purchase of fixed assets). Analysis of the sources of property formation is associated with the assessment of alternative options for financing the activities of the enterprise.
I will help everyone!
The creation of reserves both in production and in trade makes it possible to reduce the requirements for the degree of consistency in the chain of production sites or between the links of product distribution and, accordingly, reduce the costs of organizing the management of these objects.
The listed reasons indicate that entrepreneurs in both trade and industry are forced to create inventories, since otherwise losses and costs arise that reduce profits.
However, an increase in inventories leads to an increase in other types of costs (see.
§ 17.3), which also reduces profit. The level of inventory at the enterprise should be selected so that the total costs and losses for all items are minimal, i.e.
The last method is, as a rule, the most expensive, since it requires maintaining a reserve. However, in a competitive environment, the ability to immediately satisfy an order can be decisive in the fight for the consumer. Thus, a decrease in inventory may lead to losses due to decreased sales.
- Purpose of the article: reflection of information about reserves.
- Line number in the balance sheet: 1210.
- Account number according to the chart of accounts: Debit balance - 10, 11, 15, 16, 20, 21, 23, 28, 29, 43, 41, 44, 45, 97, Credit balance - 14, 42.
What does an increase in current assets show?
What current assets are made up of and what share each type accounts for can be seen in Section II of the enterprise’s balance sheet. It is necessary to analyze the structure of working capital by their groups and in dynamics, comparing the data with the readings of previous reporting periods and taking into account the specifics of the enterprise’s commercial activities.
Let's consider the most likely changes in the amount of each element of working capital.
- 1. The increase in materials and raw materials intended for production can indicate:
- or about increasing production, which is a positive factor;
- or the accumulation of excess inventories, which leads to a decrease in asset turnover and should be considered as a negative phenomenon.
2. A constant increase in the volume of finished products may indicate unsatisfactory performance of the sales department, a decrease in demand for products, and incorrect pricing policies. “Locked” funds in unsaleable inventories of products is a sure way to reduce the solvency of the enterprise and its dependence on attracting money from outside. This indicator is an alarming signal for management and requires timely decisions.
3. An increase in accounts receivable in general may also indicate positive dynamics - for example, an enterprise has developed an effective scheme for selling its goods on credit. For analysis, receivables should be differentiated:
- to “normal” - current, which is determined by the nature of the enterprise’s work; its growth may be associated with an increase in sales volumes, which is a positive trend;
- doubtful - overdue, which indicates an increase in unpaid debts of buyers. In the presence of a growing volume of doubtful debts, it is necessary to review sales and credit policies for buyers and pay attention to working with bad debts. The result of a large number of debts for which there is no payment is the same as when warehouses are overstocked. The company does not receive enough of its own funds to finance its further activities.
4. An increase in the volume of financial investments made by an enterprise can also be interpreted in two ways:
- on the one hand, this fact may indicate that the company has a large amount of free cash that can be invested for growth;
- on the other hand, excessive enthusiasm for financial investments can lead to the diversion of funds from core activities and insufficient activity of the enterprise in these activities.
An increase in current assets and their share in the property of an enterprise is, in general, a positive phenomenon, but it should not become a reason for a decrease in the turnover of funds and the solvency of the organization, as well as a factor in reducing business activity.
Current assets and their importance for the company
Current assets are the most mobile category of an organization's property. The main characteristics inherent in working capital include:
- A high level of mobility, which means, first of all, the ability of working capital to cover all current expenses and ensure a continuous production process in the company.
- High level of liquidity, that is, the ability to convert into cash equivalent as quickly as possible. It should be noted that among working capital there is also a gradation according to the degree of liquidity. Less liquid assets include accounts receivable that are unlikely to be repaid, as well as inventories stored in warehouses.
- Short period of use - less than one calendar year or less than one production cycle.
- Transfer of the value of current assets to manufactured products in full.
The increase in current assets indicates
What does a decrease in current assets indicate?
A decrease in current assets also indicates ambiguous changes occurring in the financial condition of the company. Let's consider the most likely cases of a decrease in each element of the structure of funds in circulation and their impact on the results of the enterprise's activities.
1. A decrease in inventories and raw materials, as well as goods and finished products, may indicate a curtailment of production, a lack of working capital, or unsatisfactory performance of the supply department. 2. A decrease in accounts receivable is generally viewed as a positive phenomenon. But it would be correct to evaluate it in connection with the volume of revenue:
- if receivables decrease along with a drop in sales, then this is a natural process, but the fact is not positive - such a joint decrease almost always indicates that the business is “slowing down”;
- if, with a decrease in receivables, revenue remains at the same level or grows, then we can conclude that the company’s settlement policy with customers has improved. This is a positive aspect.
Why is a balance sheet necessary?
The company's assets should always be under control. What can financial statements tell you:
- An increase in reserves indicates a positive development trend;
- An increase in non-current and current assets indicates an increase in production capacity and an increase in investment.
These factors are generally considered positive, because such indicators should provide good income in the medium term. The result is a large volume of production, the results of which there is a significant demand. This situation is possible with a large order in the long term.
At the same time, the following factors may cause investor concern:
- A decrease in fixed assets on the balance sheet indicates that the company has no liquidity and is most likely in stagnation or decline. This does not mean that it cannot be profitable in the long term, but it may require substantial investments;
- A decrease in current assets sharply increases the company's risks. On the one hand, with an increase in net revenue, this fact can be justified, but in principle it does not indicate targeted development.
Non-current assets of the enterprise in the balance sheet (lines)
In the balance sheet of a commercial organization, non-current assets are reflected as fixed assets, including:
- Intangible assets (intangible assets),
- Deferred tax assets,
- profitable investments in material assets,
- financial investments,
- vehicles,
- buildings and constructions,
- equipment, machines and tools.
Significant financial resources are spent on the acquisition of non-current assets, which are recognized as investments in production. Such investments in non-current property are reflected in the asset balance sheet, where all information about what is owned by the enterprise is accumulated. Let's consider the contents of the balance sheet lines, which reflect data on non-current assets:
| Fixed assets | Balance line | Property whose value is reflected in the line |
| Intangible assets | 1110 | By page: The difference between the debit balance in account 04 “Intangible assets” (without taking into account R&D costs) and the credit balance in account 05 “Depreciation of intangible assets”. In page: Residual value (= original price - depreciation amount) of assets to which the company has exclusive rights (computer programs, innovations, trademarks...). |
| Research and development results | 1120 | By page: Debit balance account 04 “NMA” s/ac. “R&D expenses.” On page: Information on costs of completed R&D. |
| Intangible search assets (IPA) | 1130 | By page: Debit balance account 08, account. “NPA” minus the credit balance of account 05, s/ac. “Depreciation and impairment of legal assets.” In page: Costs for geological information about the subsoil (results of sampling and exploratory drilling, geophysical and geological studies, topographic studies, etc.). |
| Material prospecting assets (MPAs) | 1140 | By page: Debit balance account 08, account. “MPA” minus the credit balance of account 02, s/ac. “Depreciation and Impairment of Tangible Exploration Assets.” In page: Cost of transport, equipment, structures used in mineral exploration and evaluation of deposits. |
| Fixed assets | 1150 | According to page: Debit balance for account 01 “Fixed assets” minus the credit balance of account 02 “Depreciation of fixed assets” (without taking into account the depreciation of income-generating investments and interbank assets). |
| Profitable investments in material assets | 1160 | According to page: Debit balance of account 03 “Income investments in MC” minus credit balance of account 02, account. “Depreciation of profitable investments in MC.” In page: Residual value of property provided by the enterprise for rent or leased or leased. |
| Financial investments | 1170 | Note: When a company provides a reserve for reducing the cost of financial investments, then in line 1170 it is necessary to reduce the cost of investments by the amount of contributions to the reserve fund (in terms of long-term investments). Per page: Information on interest-bearing loans with a repayment period of more than 12 months, purchased shares, contributions to authorized capital. On page: Debit balance account 58 “FV”, account. 55, s/sch. “Deposit accounts”, account. 73, s/sch. “Calculations for loans provided.” |
| Deferred tax assets | 1180 | Per page: Contingent assets resulting from the difference between tax accounting and accounting. Example - in tax accounting, the value of property is taken into account one-time, in accounting - gradually. — Deferred tax assets are part of deferred income taxes that reduce income taxes for payment in future tax periods. — If the company accounts for deferred assets in a collapsed manner, line 1180 records the positive difference between the balance in the debit of account 09 and the credit of account 77 “Deferred tax liabilities.” In p.1420 “IT” should be “-”. — If the company reflects the amount of tax assets in detail, the debit balance of account 09 “Deferred tax assets” is recorded in line 1180. — When the loan indicator account 77 > debit balance account 09, line 1180 contains “-”, only line 1420 is filled in. |
| Other noncurrent assets | 1190 | Line 1190 reflects other VNA that are not included in other lines of the balance sheet. |
What does an increase in non-current assets indicate?
Non-current assets are needed by an enterprise in order to see the real price of certain company assets. Typically these include:
- financial investments (investments);
- ownership of industrial property;
- objects of intellectual property;
- expenses for organizing labor and various events.
A decrease in non-current assets indicates positive and negative aspects. It is worth looking at the balance in detail and understanding why this happened. For example, if expenses were reduced, the company could do this in order to reduce the level of risk.
The investor should pay special attention to the situation in which there are more non-current assets than current ones. This fact is common among start-up enterprises, which first try to consolidate all non-current assets, and only then raise current ones. If an imbalance is visible in an enterprise in the long term, then its development is minimal and seriously susceptible to stagnation due to political, economic and legal factors.
What does an increase in inventory on the balance sheet indicate?
It is worth noting that in such a situation, an increase in currency and reserves on the balance sheet indicates an extremely rational approach to asset management.
Other non-current assets (line 1190)
The cost of all non-current assets that are not reflected in other lines of the balance sheet is reflected on line 1190. These include:
- Costs of subsequent periods with write-off periods exceeding 1 year, for example:
- lump-sum payment for means of individualization, for the right to use the results of intellectual work;
- costs for the development of natural resources, etc.
- Prepayment, advance payment for services rendered and work performed, paid for the purpose of constructing environmental facilities.
- Costs for incomplete R&D, costs for objects that in the future will be included in the financial statements as intangible assets and fixed assets (these are investments in non-current assets).
- Equipment requiring installation:
- equipment that will be put into operation only after its parts have been assembled and when it is attached to the supporting structures of the building/structure;
- spare parts for such equipment.
- Perennial plantings that have not reached the age of exploitation.
The following table shows on the basis of which accounting accounts line 1190 of the balance sheet is filled out:
| Non-current asset | Accounting account* *DS - debit balance |
| Deferred expenses whose write-off period is at least 1 year | DS ch.97 “Future expenses” |
| Prepayment and advances for services rendered and work performed on the construction of OS | DS account 60 “Settlements with suppliers and contractors” of the corresponding account. |
| Company expenses on objects that are subsequently accepted for accounting as intangible assets and fixed assets, and expenses in relation to incomplete R&D | DS of the corresponding s/ac. to account 08 “Investments in non-current assets” |
| Equipment requiring installation | DS ch.07 “Equipment for installation”. DS ch.15 “Procurement and acquisition of MC” in terms of equipment requiring installation. Balance of account 16 “Deviation in cost of MC” regarding equipment not yet installed. |
| Perennial plantings that have not reached the age of exploitation | DS account 01 “OS”, s/sch. “Young plantings.” |
Balance Sheet Analysis
??Do you want to start trading on the American market? Do it with professionals?.
Reading a company's balance sheet is one of the stages of express analysis of the financial statements (Financial Statement) of the issuing company, which gives the investor an idea of its creditworthiness, solvency, possible risks and investment attractiveness.
When analyzing a balance sheet, an investor should find out:
- What happens to the company's assets? Does the company have fixed assets? Do they correspond to the operational (core, production) activities of the company? How does working capital behave?
- Are there any sudden changes in individual balance sheet items? If so, what are the reasons that caused them?
- How is the company financed? What is the debt to equity ratio? What is the ratio of reserves and costs to the sources of their formation?
- What happens to retained earnings? This is especially important for dividend-paying companies. If retained earnings are negative, the company cannot legally pay dividends.
A “good” balance satisfies the following conditions:
- The currency (total for all accounts) of the balance sheet at the end of the reporting period increases compared to the beginning of the period.
- The growth rate of the balance sheet currency is higher than the inflation rate, but not higher than the growth rate of revenue.
- The sizes, shares and growth rates of receivables and payables are approximately the same.
- The growth rate of current assets is higher than the growth rate of non-current assets and short-term liabilities.
- The size and growth rate of long-term sources of financing (equity and long-term debt capital) exceed the corresponding indicators for non-current assets.
- The share of equity in the balance sheet currency exceeds 50%.
- There are no uncovered losses on the balance sheet.
Evaluating the results of balance sheet analysis
Balance sheet data allows a preliminary assessment of the company's solvency at the reporting date. To do this, subtract the amount of short-term liabilities from the amount of current assets. The result obtained can be called the company’s “margin of safety” in terms of solvency.
Balance sheet asset analysis
The balance sheet asset contains information about the investment of the enterprise's capital in specific property and material assets. Rational allocation capital is important for the effective operation of the enterprise as a whole. An analysis of a balance sheet asset can also be presented as an analysis of the property of an enterprise. The composition of a balance sheet asset (enterprise property) can be presented in the form of a diagram (Fig. 3.2).
Balance sheet asset analysis includes:
1. Analysis of changes in the composition of the balance sheet asset.
2. Absolute and relative changes in individual asset items (horizontal analysis).
3. Identification of trends in the dynamics of asset items.
4. Analysis of changes in the structure of the balance sheet asset (vertical analysis).
Rice. 3.2. Composition of balance sheet assets
Let's analyze the change in the balance sheet asset of the PSMiK enterprise. For this purpose, we will compile several auxiliary tables and diagrams (Table 3.2).
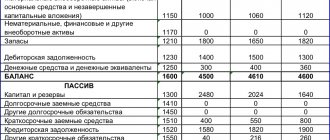
The analysis showed that during the year there was an increase in the balance sheet asset by 9273 thousand rubles, which is associated with an increase in both the value of non-current assets by 1365 thousand rubles and current assets by 7908 thousand rubles. In general, the growth rate of the enterprise's property was 107.39%, while the growth rate of current assets (109.02%) exceeds the growth rate of non-current assets (103.61%), which is a positive trend in the enterprise's activities. The growth of investments in fixed assets of the enterprise ensured an increase in the indicators of current activities to a greater extent. Current assets or current assets ensure the current activities of the enterprise.
Table 3.2
Composition and structure of balance sheet assets
| Assets | For the beginning of the year | At the end of the year | Deviation | Growth rate | ||
| thousand roubles. | % | thousand roubles. | % | thousand roubles. | % | % |
| I. Non-current assets | 30,12 | 29,06 | -1,06 | 103,61 | ||
| II. Current assets | 69,88 | 70,94 | 1,06 | 109,02 | ||
| BALANCE | 0,00 | 107,39 |
It should be noted that an increase in current assets may also indicate a slowdown in their turnover. A decrease in turnover ratios and an increase in the duration of turnover objectively cause the need to increase working capital (assets) in order to complete the planned volume of work. Analysis of turnover ratios will be performed later.
The reason for the increase in the balance sheet total (balance sheet currency) may be not only an increase in fixed assets due to development, but also a revaluation of fixed assets. In case of revaluation, both the initial and residual value of fixed assets are recalculated, which is indicated in the balance sheet. Let us assume that at the analyzed enterprise, “according to legend,” the increase in non-current assets occurred due to investment in fixed assets.
On the contrary, if the balance sheet has decreased, then this indicates a reduction in the economic activity of the enterprise, a drop in sales volumes, a decrease in demand for products, etc.
For clarity, the dynamics of a balance sheet asset can be presented in the form of a diagram (Fig. 3.3).
Rice. 3.3. Dynamics of balance sheet assets
for the beginning of the year
at the end of the year
Rice. 3.4. Balance sheet asset structure
The increase in non-current and current assets led to a change in the structure of the balance sheet asset (enterprise property). Thus, the share of non-current assets decreased by 1.06% and amounted to 29.06% at the end of the year compared to 30.12% at the beginning of the year. The share of current assets accordingly increased by 1.06% and amounted to 70.94% at the end of the year (at the beginning of the year - 69.88%). The change in the structure of the balance sheet asset is due to the excess of the growth rate of current assets over the growth rate of non-current assets . The structure of the balance sheet asset is shown in Fig. 3.4.
Next, we will analyze in detail the change in the composition and structure of non-current and current assets (Tables 3.3 and 3.4).
Table 3.3
Composition and structure of non-current assets
| Assets | For the beginning of the year | At the end of the year | Deviation | Growth rate | ||
| thousand roubles. | % | thousand roubles. | % | thousand roubles. | % | % |
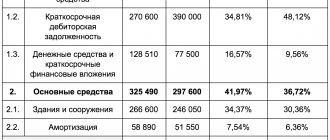
| Intangible assets | 7,94 | 4,09 | –1400 | –3,85 | 53,33 | |
| Fixed assets | 75,92 | 89,53 | 13,61 | 122,18 | ||
| Construction in progress | 9,79 | 3,58 | –2300 | –6,21 | 37,84 | |
| Long-term financial investments | 6,35 | 1,53 | –1800 | –4,82 | 25,00 | |
| Deferred tax assets | 1,28 | 1,28 | ||||
| Total non-current assets | 100,0 | 100,00 | 0,00 | 103,61 |
As part of non-current assets at the end of the year, the amount of deferred tax assets was formed - 500 thousand rubles. There was an absolute decrease in intangible assets in the amount of 1,400 thousand rubles, unfinished construction by 2,300 thousand rubles, long-term financial investments by 1,800 thousand rubles.
The increase in the total amount of non-current assets occurred due to an increase in the cost of fixed assets by 6365 thousand rubles. or by 22.18%. The increase in the value of fixed assets could occur both through the acquisition of machinery and equipment, and through the completion of construction and commissioning of buildings and structures. In the future, it is necessary to analyze in more detail the change in the composition and structure of fixed assets according to Form No. 5 “Appendix to the Balance Sheet”. In the structure of non-current assets, a large share, both at the beginning of the year and at the end of the year, is fixed assets, 75.92% and 89.53%, respectively.
It is worth noting the positive dynamics - a decrease in the share of unfinished construction from 9.79% to 3.58%. Significant financial resources of the enterprise are diverted into unfinished construction, and since this item is not involved in current production activities, an increase in the share of unfinished construction can negatively affect the financial condition of the enterprise. For more objective conclusions, it is advisable to compare the actual volumes of unfinished construction with standard indicators. The structure of non-current assets is shown in Fig. 3.5 and 3.6.
| 75,92% |
Rice. 3.5. Structure of non-current assets at the beginning of the year
Rice. 3.6. Structure of non-current assets at the end of the year
Table 3.4
Composition and structure of current assets
| Assets | For the beginning of the year | At the end of the year | Deviation | Growth rate | ||
| thousand roubles. | % | thousand roubles. | % | thousand roubles. | % | % |
| Reserves | 46,26 | 47,22 | 0,96 | 111,29 | ||
| Value added tax | 4,56 | 3,39 | -760 | -1,17 | 81,00 | |
| Accounts receivable | 42,52 | 43,99 | 1,47 | 112,79 | ||
| Short-term financial investments | 3,24 | 1,84 | -1080 | -1,40 | 61,97 | |
| Cash | 3,42 | 3,56 | 0,14 | 113,38 | ||
| Total current assets | 100,00 | 100,00 | 0,00 | 109,02 |
Increase in current assets by 7908 thousand rubles. occurred due to an increase in accounts receivable by 4,767 thousand rubles, cash by 401 thousand rubles, and inventories by 4,580 thousand rubles. An increase in funds in bank accounts indicates a strengthening of the financial condition of the enterprise. As a rule, there is no significant accumulation of funds in a bank account, since the amount of funds must be such as to ensure the repayment of priority payments.
In general, the structure of current assets has changed slightly. The share of receivables in the total amount of current assets increased from 42.52% to 43.99%; in absolute terms, the increase in receivables amounted to 4,767 thousand rubles. It should be noted that the growth of accounts receivable is not always assessed negatively. With the expansion of the enterprise's activities and the increase in sales volumes of products (works, services), the number of buyers and, consequently, accounts receivable also grows. On the other hand, a decrease in accounts receivable may indicate a decrease in sales of products (works, services) and a decrease in the number of buyers.
It is necessary to conduct a detailed analysis of accounts receivable based on Form No. 5 “Appendix to the Balance Sheet”: identify normal and overdue debt (the presence of overdue debt creates financial difficulties for the enterprise); determine the structure of accounts receivable by main debtors; how long ago the accounts receivable were formed; identify “hopeless” debtors; compare accounts receivable and accounts payable.
The analyzed enterprise is characterized by the absence of long-term receivables, payments for which are expected more than 12 months after the reporting date (Table 3.1), which has a positive effect on the financial condition of the enterprise. A comparison of accounts receivable and accounts payable shows that accounts payable exceeds accounts receivable by 5,838 thousand rubles. at the beginning of the analyzed period and by 5563 thousand rubles. at the end of the analyzed period. The gap has narrowed slightly; accounts receivable are fully covered by accounts payable. There is a positive trend in the ratio of growth rates of receivables and payables. The growth rates of accounts receivable and accounts payable differ slightly (112.79% and 110.42%, respectively) (Fig. 3.7).
The preferable situation is when receivables and payables are equal in absolute amount, and the growth rates of debts coincide. If accounts receivable exceed accounts payable, this means that the company supports debtors at its own expense. This reduces the ability of the enterprise to invest in production development and capacity increase, which, of course, affects the financial condition of the enterprise.
Rice. 3.7. Dynamics of accounts receivable and payable
The state of inventories has a significant impact on the financial condition of the enterprise. The accumulation of large inventories may indicate a decline in the business activity of the enterprise and an increase in the scale of current activities. For more substantiated conclusions, it is necessary to analyze the structure of reserves (Fig. 3.8).
The amount of inventories increased by 4580 thousand rubles. (Table 3.4), which is caused by an increase in raw materials and supplies from 36,750 thousand rubles. up to 44040 thousand rubles. (growth – 19.84%). The growth is primarily due to an increase in the scale of current activities and production volumes. An increase in inventories of raw materials and supplies and a decrease in finished products and deferred expenses influenced the change in the structure of inventories. More than 90% of reserves are represented by stocks of raw materials and supplies.
The decrease in finished products in absolute and relative terms indicates an increase in the business activity of the enterprise. An increase in the share of finished products, as a rule, leads to a long-term “freezing” of the enterprise’s working capital and, as a consequence, to a lack of cash. The latter circumstance forces the enterprise to attract additional borrowed funds, loans, and pay interest on them, which in turn leads to an increase in accounts payable both to suppliers, the budget, personnel, etc.
Rice. 3.8. Inventory structure
The general change in the structure of current assets (current assets, working capital) can be illustrated using a diagram (Fig. 3.9).
| attachments |
Rice. 3.9. Structure of current assets, %
Thus, an analysis of the balance sheet asset showed that during the year there was an increase in the balance sheet asset (enterprise property) by 7.39%. The growth rate of current assets exceeded the growth rate of non-current assets. The structure of current assets changed slightly: the share of accounts receivable increased by 1.47%, the share of cash by 0.14%, and the share of inventories by 0.96%. There are no long-term accounts receivable; the growth rates of accounts receivable and accounts payable are almost the same.
The balance sheet asset contains information about the investment of the enterprise's capital in specific property and material assets. Rational allocation capital is important for the effective operation of the enterprise as a whole. An analysis of a balance sheet asset can also be presented as an analysis of the property of an enterprise. The composition of a balance sheet asset (enterprise property) can be presented in the form of a diagram (Fig. 3.2).
Balance sheet asset analysis includes:
1. Analysis of changes in the composition of the balance sheet asset.
2. Absolute and relative changes in individual asset items (horizontal analysis).
3. Identification of trends in the dynamics of asset items.
4. Analysis of changes in the structure of the balance sheet asset (vertical analysis).
Rice. 3.2. Composition of balance sheet assets
Let's analyze the change in the balance sheet asset of the PSMiK enterprise. For this purpose, we will compile several auxiliary tables and diagrams (Table 3.2).
The analysis showed that during the year there was an increase in the balance sheet asset by 9273 thousand rubles, which is associated with an increase in both the value of non-current assets by 1365 thousand rubles and current assets by 7908 thousand rubles. In general, the growth rate of the enterprise's property was 107.39%, while the growth rate of current assets (109.02%) exceeds the growth rate of non-current assets (103.61%), which is a positive trend in the enterprise's activities. The growth of investments in fixed assets of the enterprise ensured an increase in the indicators of current activities to a greater extent. Current assets or current assets ensure the current activities of the enterprise.
Table 3.2
Composition and structure of balance sheet assets
| Assets | For the beginning of the year | At the end of the year | Deviation | Growth rate | ||
| thousand roubles. | % | thousand roubles. | % | thousand roubles. | % | % |
| I. Non-current assets | 30,12 | 29,06 | -1,06 | 103,61 | ||
| II. Current assets | 69,88 | 70,94 | 1,06 | 109,02 | ||
| BALANCE | 0,00 | 107,39 |
It should be noted that an increase in current assets may also indicate a slowdown in their turnover. A decrease in turnover ratios and an increase in the duration of turnover objectively cause the need to increase working capital (assets) in order to complete the planned volume of work. Analysis of turnover ratios will be performed later.
The reason for the increase in the balance sheet total (balance sheet currency) may be not only an increase in fixed assets due to development, but also a revaluation of fixed assets. In case of revaluation, both the initial and residual value of fixed assets are recalculated, which is indicated in the balance sheet. Let us assume that at the analyzed enterprise, “according to legend,” the increase in non-current assets occurred due to investment in fixed assets.
On the contrary, if the balance sheet has decreased, then this indicates a reduction in the economic activity of the enterprise, a drop in sales volumes, a decrease in demand for products, etc.
For clarity, the dynamics of a balance sheet asset can be presented in the form of a diagram (Fig. 3.3).
Rice. 3.3. Dynamics of balance sheet assets
for the beginning of the year
at the end of the year
Rice. 3.4. Balance sheet asset structure
The increase in non-current and current assets led to a change in the structure of the balance sheet asset (enterprise property). Thus, the share of non-current assets decreased by 1.06% and amounted to 29.06% at the end of the year compared to 30.12% at the beginning of the year. The share of current assets accordingly increased by 1.06% and amounted to 70.94% at the end of the year (at the beginning of the year - 69.88%). The change in the structure of the balance sheet asset is due to the excess of the growth rate of current assets over the growth rate of non-current assets . The structure of the balance sheet asset is shown in Fig. 3.4.
Next, we will analyze in detail the change in the composition and structure of non-current and current assets (Tables 3.3 and 3.4).
Table 3.3
Composition and structure of non-current assets
| Assets | For the beginning of the year | At the end of the year | Deviation | Growth rate | ||
| thousand roubles. | % | thousand roubles. | % | thousand roubles. | % | % |
| Intangible assets | 7,94 | 4,09 | –1400 | –3,85 | 53,33 | |
| Fixed assets | 75,92 | 89,53 | 13,61 | 122,18 | ||
| Construction in progress | 9,79 | 3,58 | –2300 | –6,21 | 37,84 | |
| Long-term financial investments | 6,35 | 1,53 | –1800 | –4,82 | 25,00 | |
| Deferred tax assets | 1,28 | 1,28 | ||||
| Total non-current assets | 100,0 | 100,00 | 0,00 | 103,61 |
As part of non-current assets at the end of the year, the amount of deferred tax assets was formed - 500 thousand rubles. There was an absolute decrease in intangible assets in the amount of 1,400 thousand rubles, unfinished construction by 2,300 thousand rubles, long-term financial investments by 1,800 thousand rubles.
The increase in the total amount of non-current assets occurred due to an increase in the cost of fixed assets by 6365 thousand rubles. or by 22.18%. The increase in the value of fixed assets could occur both through the acquisition of machinery and equipment, and through the completion of construction and commissioning of buildings and structures. In the future, it is necessary to analyze in more detail the change in the composition and structure of fixed assets according to Form No. 5 “Appendix to the Balance Sheet”. In the structure of non-current assets, a large share, both at the beginning of the year and at the end of the year, is fixed assets, 75.92% and 89.53%, respectively.
It is worth noting the positive dynamics - a decrease in the share of unfinished construction from 9.79% to 3.58%. Significant financial resources of the enterprise are diverted into unfinished construction, and since this item is not involved in current production activities, an increase in the share of unfinished construction can negatively affect the financial condition of the enterprise. For more objective conclusions, it is advisable to compare the actual volumes of unfinished construction with standard indicators. The structure of non-current assets is shown in Fig. 3.5 and 3.6.
| 75,92% |
Rice. 3.5. Structure of non-current assets at the beginning of the year
Rice. 3.6. Structure of non-current assets at the end of the year
Table 3.4
Composition and structure of current assets
| Assets | For the beginning of the year | At the end of the year | Deviation | Growth rate | ||
| thousand roubles. | % | thousand roubles. | % | thousand roubles. | % | % |
| Reserves | 46,26 | 47,22 | 0,96 | 111,29 | ||
| Value added tax | 4,56 | 3,39 | -760 | -1,17 | 81,00 | |
| Accounts receivable | 42,52 | 43,99 | 1,47 | 112,79 | ||
| Short-term financial investments | 3,24 | 1,84 | -1080 | -1,40 | 61,97 | |
| Cash | 3,42 | 3,56 | 0,14 | 113,38 | ||
| Total current assets | 100,00 | 100,00 | 0,00 | 109,02 |
Increase in current assets by 7908 thousand rubles. occurred due to an increase in accounts receivable by 4,767 thousand rubles, cash by 401 thousand rubles, and inventories by 4,580 thousand rubles. An increase in funds in bank accounts indicates a strengthening of the financial condition of the enterprise. As a rule, there is no significant accumulation of funds in a bank account, since the amount of funds must be such as to ensure the repayment of priority payments.
In general, the structure of current assets has changed slightly. The share of receivables in the total amount of current assets increased from 42.52% to 43.99%; in absolute terms, the increase in receivables amounted to 4,767 thousand rubles. It should be noted that the growth of accounts receivable is not always assessed negatively. With the expansion of the enterprise's activities and the increase in sales volumes of products (works, services), the number of buyers and, consequently, accounts receivable also grows. On the other hand, a decrease in accounts receivable may indicate a decrease in sales of products (works, services) and a decrease in the number of buyers.
It is necessary to conduct a detailed analysis of accounts receivable based on Form No. 5 “Appendix to the Balance Sheet”: identify normal and overdue debt (the presence of overdue debt creates financial difficulties for the enterprise); determine the structure of accounts receivable by main debtors; how long ago the accounts receivable were formed; identify “hopeless” debtors; compare accounts receivable and accounts payable.
The analyzed enterprise is characterized by the absence of long-term receivables, payments for which are expected more than 12 months after the reporting date (Table 3.1), which has a positive effect on the financial condition of the enterprise. A comparison of accounts receivable and accounts payable shows that accounts payable exceeds accounts receivable by 5,838 thousand rubles. at the beginning of the analyzed period and by 5563 thousand rubles. at the end of the analyzed period. The gap has narrowed slightly; accounts receivable are fully covered by accounts payable. There is a positive trend in the ratio of growth rates of receivables and payables. The growth rates of accounts receivable and accounts payable differ slightly (112.79% and 110.42%, respectively) (Fig. 3.7).
The preferable situation is when receivables and payables are equal in absolute amount, and the growth rates of debts coincide. If accounts receivable exceed accounts payable, this means that the company supports debtors at its own expense. This reduces the ability of the enterprise to invest in production development and capacity increase, which, of course, affects the financial condition of the enterprise.
Rice. 3.7. Dynamics of accounts receivable and payable
The state of inventories has a significant impact on the financial condition of the enterprise. The accumulation of large inventories may indicate a decline in the business activity of the enterprise and an increase in the scale of current activities. For more substantiated conclusions, it is necessary to analyze the structure of reserves (Fig. 3.8).
The amount of inventories increased by 4580 thousand rubles. (Table 3.4), which is caused by an increase in raw materials and supplies from 36,750 thousand rubles. up to 44040 thousand rubles. (growth – 19.84%). The growth is primarily due to an increase in the scale of current activities and production volumes. An increase in inventories of raw materials and supplies and a decrease in finished products and deferred expenses influenced the change in the structure of inventories. More than 90% of reserves are represented by stocks of raw materials and supplies.
The decrease in finished products in absolute and relative terms indicates an increase in the business activity of the enterprise. An increase in the share of finished products, as a rule, leads to a long-term “freezing” of the enterprise’s working capital and, as a consequence, to a lack of cash. The latter circumstance forces the enterprise to attract additional borrowed funds, loans, and pay interest on them, which in turn leads to an increase in accounts payable both to suppliers, the budget, personnel, etc.
Rice. 3.8. Inventory structure
The general change in the structure of current assets (current assets, working capital) can be illustrated using a diagram (Fig. 3.9).
| attachments |
Rice. 3.9. Structure of current assets, %
Thus, an analysis of the balance sheet asset showed that during the year there was an increase in the balance sheet asset (enterprise property) by 7.39%. The growth rate of current assets exceeded the growth rate of non-current assets. The structure of current assets changed slightly: the share of accounts receivable increased by 1.47%, the share of cash by 0.14%, and the share of inventories by 0.96%. There are no long-term accounts receivable; the growth rates of accounts receivable and accounts payable are almost the same.
Financial analysis of the balance sheet
How to use key balance sheet indicators to evaluate a company's growth rate?
How to develop measures to increase the financial stability of an enterprise?
The main goal of financial analysis of an enterprise is to determine whether it can effectively finance its current production activities and long-term development prospects. The information base for such analysis is primarily the balance sheet.
However, a simple analysis to assess changes in the absolute values of its individual items may not give the desired results due to the incomparability of estimates both across the years of the company’s activity and when comparing them across different business entities.
Therefore, in this analysis, relative indicators become much more valuable. They are more convenient for comparison in a spatiotemporal context. Taking this into account, in this article the main emphasis when conducting a financial analysis of an enterprise is on the use of relative indicators and criteria (ratios).