Why does a director need to understand financial statements?
The manager is responsible for everything that happens in his company, including accounting. Although the chief accountant or another financial specialist prepares the reports, it is the director who certifies them. The current balance sheet form does not provide for a second signature at all.
Naturally, the manager must understand what he is signing and be able to identify dubious places in the report.
In addition, balance sheets of other organizations often end up on the director’s desk. The fact is that when signing an agreement with a new partner, businessmen usually request detailed information about him, which includes financial statements.
Of course, the counterparties' reports will first be analyzed by the company's financiers. But the last word on concluding a contract in any case remains with the director. He must weigh all the factors, including independently studying the reporting of a potential partner, without relying only on the opinion of his subordinates.
We will consider the analysis methodology using the example of simplified forms of financial statements.
The current form of the balance sheet shows data for three dates: the beginning and end of the reporting year, as well as the beginning of the previous year. Form No. 2 also includes two years of information. Therefore, you can see how the indicators change over time
Balance sheet (form No. 1)
Financial results report (form No. 2)
Vertical balance sheet analysis (structural). Examples with conclusions
Basic information about vertical analysis of accounting data can be seen in the list below:
- Structural analysis is to demonstrate the structure of the final accounting information. reporting in the form of relative indicators expressed as percentages. As a result of the study, the expert receives the values of all balance sheet items as a percentage of its total.
- The advantage of vertical analysis over horizontal analysis is that in absolute terms it is difficult to see whether positive or negative dynamics are observed in the company’s work. Relative values, on the contrary, make it easy to assess whether financial indicators have deviated for the worse or for the better, and to what extent. The obtained output data in relative values will not allow for incorrect comparisons due to the influence of various external factors, such as the inflationary process.
- This method of analysis differs from horizontal analysis in that vertical analysis is focused on a selected moment and provides an assessment of the company’s position on the day the report is issued. The method is used when necessary:
- see how certain accounting items have changed in comparison with previous periods. balance;
- compare the capital structures of several companies or enterprises in different fields of activity;
- find out the composition of external and working capital;
- find out whether the size of the company's borrowed capital has decreased or increased;
- check how the structure of liabilities and assets has changed.
The essence of using structural balance sheet analysis is as follows:
- The total amount of revenue when analyzing the company's financial performance statement (form No. 2) is taken equal to 100%. If the balance sheet is examined, the total amount of assets is taken as 100%. Vertical analysis is also suitable for studying the statement of cash flows (form No. 4) and changes in capital (form No. 3).
- All balance sheet items are individually calculated as a percentage of 100% (i.e., the total amount of assets or revenue). To implement this, the analyst must select the period (year) of activity of the analyzed company, and then divide each individual balance sheet line by the accounting currency. balance, and then multiply the result by one hundred percent (since the value must be relative, in %).
Let's return to point 2 of the algorithm, which was given above the table. Let's find out how the values in the table were obtained using the example of current assets:
- For January 1, 2015:
- For January 1, 2016:
- Increase in assets in 2016 compared to last year:
Now that we understand how the data in the table was calculated, let's analyze it and draw conclusions:
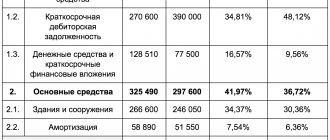
- The amount of long-term debt of the analyzed company decreased slightly.
- The amount of equity (shareholder) capital is 50% of the total liabilities (this indicates that the company is characterized by an average level of stability).
- Short-term debt makes up a third of the balance sheet and remains virtually unchanged.
- The number of OS objects is reduced because some of them are going out of circulation.
- 63% of assets account for working capital, and the increase in their share was a consequence of the growth of accounts receivable (the company's management should think about the reasons for its growth).
Let's try to conduct a vertical analysis of data for 2 years of operation of the enterprise in absolute and relative values:
In general, the interpretation of a set of balance sheet output data is carried out by professional financial analysts and auditors, since it is necessary to be able to see the big picture and draw conclusions based on comprehensive research. What can be said unambiguously to a non-specialist, looking at the table we received, is that:
- the analyzed company has no changes in its own funds in the form of authorized capital, but the amount of available equity capital has increased by 8% due to the presence of retained earnings;
- the company has attracted a fairly large amount of borrowed funds, liabilities include >60% of accounts payable, but the positive side is a decrease in the level of loans in dynamics;
- the enterprise is solvent and quite stable financially, since there is a decent level of cash (48.22%);
- the company does not competently select counterparties for cooperation; most likely, the current partners are insolvent, because there is a high level of accounts receivable;
- the data from the table indicates that the level of accounts receivable and inventory of the company is high, and therefore there are fewer non-current assets than current assets (the bad thing is that there may be extra costs for storing inventory (logistics), but the good thing is that managers care about investing funds into uninterrupted production).
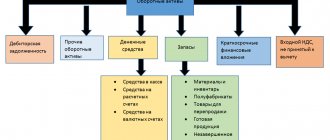
Balance sheet asset
Let's start looking at the balance sheet from the asset. This section reflects the company's resources that it can use to conduct business. Assets are arranged in descending order of liquidity, i.e. the ability to quickly implement them and receive money ( Latin liquidus - “flowing”).
Non-current assets or fixed assets (line 1150) - real estate, equipment, transport, etc.
If your company did not buy or sell fixed assets in the previous two years, then this figure will decrease slightly (on average by several percent per year) due to depreciation. This is the option discussed in the example.
If there were such purchases, then the indicator of non-current assets as of the last reporting date should be higher than for the previous ones.
If you are considering the balance sheet of a third-party company, then the presence of significant fixed assets is one of the indicators that indicates the reliability of a potential partner.
Of course, this does not mean that there is no need to work with counterparties whose indicators on line 1150 are small or zero. For example, many quite successful trading or transport companies actively use rented premises or cars.
Intangible assets (p. 1170) - patents, licenses, etc. They are also subject to depreciation and are reflected in the balance sheet according to the same rules as fixed assets. In our example, they are not present, because we are considering the balance sheet of a small enterprise, for which this type of asset is not very typical.
Inventories (p. 1210) include goods, finished goods, raw materials, and work in progress.
Their growth in dynamics should not exceed the growth rate of revenue, otherwise this indicates that the efficiency of using the company’s resources is decreasing.
To determine the average annual size of inventories, you need to add up the data at the beginning and end of the year and divide the amount by 2. The average annual indicators for other balance sheet items are determined in the same way.
Of course, to more accurately determine average annual figures, it is better to use the values at the beginning of each month. But now we are talking about analysis based on standard balance sheet data, and it does not contain monthly information.
Why you need to read financial statements
Analysis of financial statements allows investors to understand the current state of affairs of the enterprise: assess the financial condition and stability, the level of debt, as well as how successfully the business operates and whether the company has the ability to grow and develop.
Analysis of financial results helps you make an informed investment decision. Purchasing securities based on news or market prices can be impulsive and erroneous. By purchasing shares, an investor becomes a co-owner of the company, and in order to make a profit, it is important to understand what its prospects are.
You can find a sample analysis of financial statements of issuers on the channels of experienced investors, for example, on Nazar Shchetinin’s YouTube channel.
Example
Z2018 = (1820 + 1650) / 2 = 1735 thousand rubles.
Z2019 = (1650 + 1800) / 2 = 1725 thousand rubles.
Z2019 / Z2018 = 1725 / 1735 = 99%
V2019 / V2018 = 28000 / 20000 = 140%
Revenue increased significantly, but inventories remained almost at the same level. This suggests that the company has begun to use them much more effectively.
Accounts receivable (p. 1230) are debts to the company. Primarily we are talking about buyers, but there may also be other types of debts, for example:
- suppliers for advances issued;
- budget for overpayment of taxes;
- personnel for accountable amounts.
The best thing is when the “receivables” decrease. If it grows, then the growth rate should be lower than that of revenue.
It is also desirable that accounts receivable do not exceed accounts payable (p. 1520).
Example
DZ2018 = (1300 + 1500) / 2 = 1400 thousand rubles.
DZ2019 = (1500 + 1400) / 2 = 1450 thousand rubles.
KZ2018 = (1900 + 260 + 1820 + 216) / 2 = 2098 thousand rubles.
KZ2019 = (1820 + 216 + 1580 + 40) / 2 = 1828 thousand rubles.
Accounts receivable is growing, but only slightly (1450 / 1400 - 1400 = 4%). This is much lower than the revenue growth rate (40%). In addition, it is significantly lower than accounts payable. This indicates that the company's debt management system is working effectively (provided that accounts payable are repaid without delay).
Cash (p. 1250) is a very fast-moving metric. Many companies almost completely spend all the money they receive, so the figure for this item may be small. But if an organization pays its obligations on time, then the minimum account balance at the end of the period does not indicate problems with the company’s finances.
Liability balance
The liabilities side of the balance sheet lists the sources of funds from which the company finances its assets.
The article “Capital and reserves” (page 1300) for most LLCs consists of two parts:
- Authorized capital is the funds that the founders invested when creating the business. According to the law, for an LLC it must be no less than 10 thousand rubles, and for a public joint-stock company - no less than 100 thousand rubles. The larger the authorized capital, the more reliable the company is in the eyes of counterparties, banks, investors, etc.
- Retained earnings are that part of the company's profits that the founders decided to keep in circulation.
If the authorized capital did not change and the owners of the company did not receive dividends, then the difference between the indicators on line 1300 at the beginning and end of the year will be equal to the financial result. This is exactly the case considered in our example.
Change in capital for 2022 and 2022
K2018 = 2024 – 1640 = 384 thousand rubles.
K2019 = 2480 – 2024 = 456 thousand rubles.
These amounts are equal to the company's net profit on Form No. 2 for 2022 and 2019, respectively.
The item “Long-term borrowed funds” (p. 1410) includes all loans and borrowings received for a period of more than a year.
The article “Short-term borrowed funds” (p. 1510) combines “short-term” loans and borrowings, i.e. received for less than a year.
The mere presence of borrowed funds and an increase in their amount does not mean that the company has problems. However, if loan debts are growing, but revenue remains stagnant or even falls, then this should cause concern. Most likely, in this case, the bank’s money is not invested in development, but is used to “plug holes.”
In our example, revenue increases, but the amount of debt on loans decreases. This indicates the effective use of borrowed funds.
The item “Other long-term liabilities” (page 1450) also lists the company's debts that are due in more than a year. But here we are talking about all other similar debts (except for banks), for example, under long-term contracts with suppliers.
The items “Accounts payable” (p. 1520) and “Other short-term liabilities (p. 1550) include all “non-bank” debts of the organization with a short maturity.
This includes not only debts to counterparties, but also current debts on taxes, wages, accountable amounts, etc.
Short-term accounts payable must be no less than accounts receivable and must not grow at a faster rate than revenue. In our example, the “creditor” even decreases, but the revenue increases.
Brief information about the balance sheet
The balance sheet is a key type of reporting, thanks to which the company’s management has the opportunity to see the dynamics of the enterprise’s development in specific figures, the presence of short-term and long-term debts, the origin of funds, as well as the volume of fixed/working assets.
Take our proprietary course on choosing stocks on the stock market → training course
The balance sheet is often called a financial entity, due to the fact that the information contained in the statements clearly demonstrates to company managers and analysts the risks of ruin and development prospects, as well as the rate of growth (decline).
The results of the balance sheet are 2 parts, equal to each other (if the balance sheet is drawn up correctly):
- ASSETS (money, material assets, machinery, equipment, buildings and structures, inventories, debts of counterparties and consumers, etc.) - everything that a company owns and disposes of for the purpose of carrying out commercial activities and making a profit.
- LIABILITIES (short-term liabilities to counterparties and clients, borrowed funds, retained earnings, own (share) capital) - information about the sources of the company's assets.
Horizontal and vertical business analysis can help company management find weaknesses in the company’s activities and options for correcting errors.
| Business valuation | Financial analysis according to IFRS | Financial analysis according to RAS |
| Calculation of NPV, IRR in Excel | Valuation of stocks and bonds |
Analysis of financial ratios
To draw conclusions about the financial position of a company, it is necessary not only to analyze absolute indicators, but also to calculate the relationships between them, i.e. – coefficients. They, like absolute numbers, also need to be studied over time in order to draw conclusions about business development trends. Let's consider the main financial indicators that can be obtained based on financial statements.
- Profitability is the ratio of net profit to revenue or assets. To calculate it, not only the balance sheet is used, but also another main accounting form - the income statement.
Return on sales:
Rp = PE / V
Return on assets:
Ra = PE / A
If a company operates successfully, then not only its revenue and net profit should grow, but also its profitability percentage.
How to Read a Balance Sheet for Analysis
Accounting reporting is necessary for both internal and external users. Moreover, in the latter case, three degrees of financial interest can be distinguished:
- obvious interest - analysis is carried out by an investor, a credit institution, to determine the profitability of the entity;
- hidden interest - the Federal Tax Service, extra-budgetary funds and law enforcement agencies can analyze the balance when carrying out control activities to ensure compliance with the law;
- lack of interest - statistical bodies, auditors, courts, media, analysts, whose goal is not related to the financial well-being of the subject.
When carrying out the analysis, absolute importance is attached to the specifics of the business and the dynamics of indicators.
Example
| Period | Revenue | Net profit | Return on sales |
| 2018 | 20000 | 384 | 1,9% |
| 2019 | 28000 | 456 | 1,6% |
| Period | Assets | Net profit | Return on assets |
| 2018 | 4605 | 384 | 8,3% |
| 2019 | 4555 | 456 | 10,0% |
The tables show that, although absolute profit has increased, the percentage of return on sales has decreased slightly. Company management needs to pay attention to the cost structure.
But the return on assets has increased significantly, i.e. The efficiency of using the company's resources as a whole is growing.
- Capital structure. It is characterized by the autonomy coefficient - the ratio of equity capital to assets.
KA = SK / A
In the simplified balance sheet structure, equity is line 1300 “Capital and reserves”. Assets are the result of the balance sheet, i.e. line value 1600.
Sometimes in the economic literature you can find an indication that the normative value of CA should not be lower than 0.5. Those. business owners must finance the company with at least half of their own funds.
However, this approach in many cases resembles measuring the “average temperature in a hospital.” Much depends on the specifics of the business, primarily on the field of activity.
If we are talking about a trading company, then KA may be lower, reaching 0.3. Such companies often rent premises and equipment, and take the goods for sale.
For complex high-tech industries the situation will be the opposite. The owners of such companies usually try to acquire ownership of equipment and production premises. Indeed, in such a situation, any problems with landlords and the need to move can paralyze the business for a long time.
But in any case, the CA should not be overestimated - up to 0.7 - 0.8 or more. This, of course, increases financial stability, but deprives the company of potential income from the use of borrowed funds.
Example
| date | Equity | Assets | CA |
| 31.12.2017 | 1640 | 4600 | 0,36 |
| 31.12.2018 | 2024 | 4610 | 0,44 |
| 31.12.2019 | 2480 | 4500 | 0,55 |
The table shows that CA is growing steadily and reaching the average standard value as of the last reporting date.
- Solvency. The main indicator that characterizes a company's ability to pay off its obligations is the total liquidity ratio. It is equal to the ratio of current assets to short-term liabilities
Klo = OA / KP
Current assets are the sum of inventories, accounts receivable and cash.
OA = page 1210 + page 1230 + page 1250
Short-term liabilities are the sum of all short-term debts of the enterprise.
KP = page 1510 + 1520 + page 1550
The Klo standard can vary from 1 to 2.5. Those. Even in the most extreme case, debts with short maturities should be fully covered by liquid assets.
And here, too, a lot depends on the direction of the company. Trading firms can allow a reduction in KLo to values slightly exceeding 1, because their inventory is usually easy to sell if necessary.
It is usually more difficult for manufacturing enterprises to sell stock balances in warehouses, therefore KLo for them should be higher, approximately in the range of 1.5 - 2.5. But there is no need to increase this coefficient too much either, because while resources are in reserves.
How to learn to read a balance sheet
To read the main form of financial statements, you should take note of the following axioms:
- the growth of the balance sheet currency (the total of the “Asset” and “Liability” sections) is considered a positive thing. If the currency is kept at the same level, for example, against the backdrop of a crisis, this is also a good achievement;
- the mobility of resources is evidenced by the excess of current assets (result of section II of the Asset) over non-current assets (result of section I of the Asset);
- a decrease in the “Fixed Assets” indicator indicates a lack of modernization, obsolescence of equipment, or even a reduction in production capacity;
- increase in capital, incl. at the expense of reserves and profits (the result of Section III of Liabilities), demonstrates the sustainability of the enterprise;
- the excess of own funds over borrowed funds (sections IV, V of the Liability) also indicates the firm’s independence from external financial sources;
- having obligations is not always a bad sign. For example, accounts payable are quite acceptable if there are accounts receivable in approximately the same amount.
Example
| date | Current assets | Short-term liabilities | Klaw |
| 31.12.2017 | 3480 | 2960 | 1,18 |
| 31.12.2018 | 3550 | 2586 | 1,37 |
| 31.12.2019 | 3500 | 2020 | 1,73 |
CL is steadily increasing and reached 1.73 as of the last reporting date. This indicator allows you to ensure solvency for a company from any field of activity.