One of the characteristics of a stable position of an enterprise is its financial stability.
The following financial stability coefficients characterize independence for each element of the enterprise’s assets and for property as a whole, making it possible to measure whether the company is financially stable enough.
Autonomy coefficient
Financial dependency ratio
Debt to equity ratio
Maneuverability coefficient of own working capital
Ratio of mobile and immobilized assets
Working capital coverage ratio from own sources of financing
Own funds ratio
Inventory coverage ratio with own funds
Capital preservation ratio
The simplest financial stability ratios characterize the relationship between assets and liabilities as a whole, without taking into account their structure. The most important indicator of this group is the coefficient of autonomy (or financial independence, or concentration of equity capital in assets).
The stable financial position of an enterprise is the result of skillful management of the entire set of production and economic factors that determine the results of the enterprise. Financial stability is determined both by the stability of the economic environment within which the enterprise operates, and by the results of its functioning, its active and effective response to changes in internal and external factors.
The main task of analyzing the financial stability of an enterprise is to assess the degree of independence from borrowed sources of financing. In the process of analysis, it is necessary to answer the questions: how independent is the company from a financial point of view, is the level of this independence increasing or decreasing, and whether the state of its assets and liabilities meets the objectives of its financial and economic activities.
In the classical theory of financial reporting analysis, financial stability is understood as such a ratio of assets and liabilities of an organization that guarantees a certain level of risk of insolvency of the organization. Thus, as indicators of financial stability, coefficients characterizing the structure of assets and liabilities of the balance sheet, as well as the relationship between individual items of assets and liabilities ( relative indicators of financial stability)
).
Autonomy coefficient (financial independence, concentration of equity capital in assets)
Characterizes the independence of the enterprise from borrowed funds and shows the share of its own funds in the total cost of all funds of the enterprise. The higher the value of this coefficient, the more financially sound, stable and more independent the enterprise is from external creditors:
Autonomy (independence) coefficient = Own capital / Assets
Ka = (p. 490 + p. 640 + p. 650) / p. 700 form No. 1
or
Ka = page 490 / page 700
According to the form of the balance sheet since 2011, the formula has the form: Ka = line 1300 / line 1600
The normative generally accepted value of the indicator is considered to be a value of the autonomy coefficient greater than 0.5 but not more than 0.7. But it is necessary to take into account that the independence coefficient significantly depends on industry specifics (the ratio of non-current and current assets). The higher the share of non-current assets of an enterprise (production requires a significant amount of fixed assets), the more long-term sources are needed to finance them, which means that the share of equity capital should be greater (the higher the autonomy coefficient).
Note that in international practice, the debt ratio (financial dependence coefficient) indicator is widespread, which is the opposite in meaning to the autonomy coefficient, but also characterizes the ratio of equity and borrowed capital. A fairly high level of independence coefficient in the USA and European countries is considered to be 0.5-0.6. At the same time, the amount of liabilities does not exceed the amount of own funds, which provides creditors with an acceptable level of risk. In Asian countries (Japan, South Korea), a value of 0.3 is considered sufficient. In the absence of justified standards, this indicator is assessed dynamically. A decreasing value indicates an increase in risk and a decrease in financial stability. Moreover, with an increase in the share of liabilities, not only does the risk of non-repayment increase, in addition, interest expenses increase, and the company’s dependence on possible changes in interest rates increases.
Financial Strength Analysis: Capitalization Ratio
The capitalization ratio is derived from the size of long-term loans in comparison with all sources of “long” money in the company and its own assets. This ratio indicates whether the company has enough capital, which can be considered a kind of assessment of business risks. The higher it is, the stronger the dependence on loans and, accordingly, the lower the stability. That is, in this way one can judge the return on equity of the company. The capitalization rate is calculated using the following formula:
Capitalization ratio = Long-term liabilities / (Long-term liabilities + Equity)
This ratio shows the structure of long-term financing. The capitalization of the company in this sense is reflected in the amount of stable liabilities - long-term debts and its resources.
The optimal value of this coefficient very much depends on the area of business, and therefore has no general regulatory significance. But we can say that from an investment point of view, companies where equity capital prevails over loans are more attractive.
Financial dependency ratio
Financial dependence coefficient, characterizing dependence on external sources of financing (i.e., what share in the entire capital structure is borrowed funds). The indicator is widely used in the West. The indicator is defined as the ratio of total debt (sum of short-term liabilities and long-term liabilities) and total assets.
Financial dependence ratio = Liabilities / Assets
In accordance with the Order of the Ministry of Regional Development of the Russian Federation dated April 17, 2010 No. 173, the financial dependence coefficient is determined by the formula:
Kfz = (D0 + KO - Zu + Dbp + R) / P
where, Kfz - coefficient of financial dependence; D0 - long-term liabilities; KO - short-term liabilities; Zu - debt to the founders; Dbp - future income; P - reserves for future expenses; P - liabilities.
Kfz = (p. 590 + p. 690 - p. 630 - p. 640 - p. 650) / p. 700 f. No. 1
Kfz = (page 1400 + page 1500 - Zu - page 1530 - page 1540) / page 1700
Note that the line “Debt to participants (founders) for payment of income” (in the previous form - code 630) is excluded from the new form, since this debt is a payable and can be disclosed in the notes to the financial statements.
The recommended value of this coefficient should be less than 0.8. The optimal ratio is 0.5 (i.e. an equal ratio of equity and debt capital). If the indicator is less than 0.8, it means that liabilities should occupy less than 80% of the capital structure.
Stage 1. Analysis of absolute indicators of the organization’s financial stability
Let's get acquainted with the calculation of two quantities. We're talking about:
- net assets;
- own working capital.
Net assets are assets cleared of liabilities. The value shows what part of the company's property was acquired from its own sources. The higher the value, the better.
Here is a simplified formula for calculating them:
HA = A – O
Where:
- A – assets (line 1600 of the balance sheet);
- O – liabilities (sum of lines 1400 and 1500 of the balance sheet).
It follows from the formula that net assets and equity capital (SC) are equal to each other. This is so because the balance sheet equation looks like this: A = CK + O.
And this is a more complex approach. Regulated by order of the Ministry of Finance of the Russian Federation dated August 28, 2014 No. 84n. Here is the formula based on it:
NA = (A – DZ UK ) – (O – DBP)
Where:
- DZUK - receivables of the founders for contributions to the authorized capital (there is no separate line in the balance sheet, the amount can be found in the balance sheet as a debit balance on account 75);
- DBP – deferred income in connection with the receipt of government assistance and gratuitous receipt of property (line 1530 of the balance sheet).
Note: DZUK and DBP are often absent. Therefore, the first calculation option is usually used.
What can be learned from the FA? Two points.
First. Are your own sources of property increasing?
If net assets are growing year after year, then this is what is happening. Moreover, such growth of assets is the most beneficial. An increase in equity capital does not bury the enterprise in a hole of debt and does not lead to an increase in interest costs on loans and borrowings.
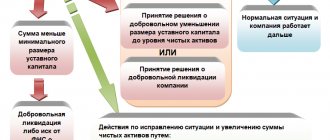
Second. Does the company need to reduce its authorized capital or even liquidate?
The Laws “On JSC” and “On LLC” oblige organizations to annually calculate the net assets and compare them with the authorized capital. If they turn out to be less, then the latter must be reduced so that it becomes no higher than the NA.
There are situations when there is no room to reduce the authorized capital. For example, it was already at the minimum acceptable level (10 thousand rubles for LLCs and non-public joint-stock companies, 100 thousand rubles for PJSC). Or the NAs turned out to be negative. This happens when a company has accumulated a huge uncovered loss. That is, for several years in a row, its expenses were higher than its income. Or so it turned out based on the results of one year, but the excess of the former over the latter was multiple.
In any of these cases, the company must declare its liquidation. This is a requirement from paragraph 4 of Art. 30 and paragraph 6 of Art. 35 Laws “On LLC” and “On JSC”, respectively.
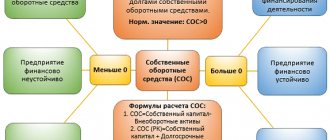
The second absolute indicator for assessing financial stability is own working capital (SOC). It has other names. For example, own working capital or net working capital.
The meaning is somewhat similar to NAV, because these are current assets minus liabilities. SOS reflect what part of the turnover is financed from the organization’s own sources. The larger the value, the less the company depends on external borrowings, which means the higher its financial stability.
Calculated using one of two formulas:
SOS 1 = OA – O
SOS 2 = SK – VA
Where:
- OA – current assets (line 1200 of the balance sheet);
- SK – equity capital (line 1300 of the balance sheet);
- VA – non-current assets (line 1100 of the balance sheet).
Calculation using any of them will give the same result. The reason is balance sheet equality. A shortened version of it was given above. Here is a more expanded one: VA + OA = SK + O.
SOS can be negative. It means that the company's current assets are formed only from liabilities. This is an extremely negative phenomenon.
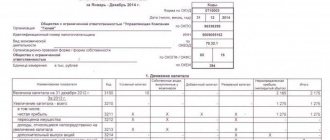
An assessment of the type of financial stability, as well as the calculation of several coefficients, are based on the value of this indicator. We will talk about this in the next parts of the article. For now, let's turn to practice. Let's calculate in Table 1 the NA and SOS for Yasnaya Polyana OJSC.
Table 1
. We calculate absolute indicators of financial stability
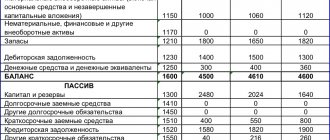
| Indicator, million rubles. | 31.12.2019 | 31.12.2020 |
| Initial data: | ||
| – assets | 3 268,0 | 2 550,8 |
| – current assets | 1 165,5 | 362,2 |
| – accounts receivable for contributions to the authorized capital | 0,0 | 0,0 |
| - long term duties | 536,7 | 345,6 |
| - Short-term liabilities | 664,3 | 608,3 |
| - revenue of the future periods | 0,0 | 0,0 |
| Estimated values: | ||
| – net assets | 2 067,1 | 1 596,9 |
| = (3 268,0 – 0,0) – (536,7 + 664,3 – 0,0) | = (2 550,8 – 0,0) – (345,6 + 608,3 – 0,0) | |
| – own working capital | -35,4 | -591,8 |
| = 1 165,5 – 536,7 – 664,3 | = 362,2 – 345,6 – 608,3 | |
Both figures fell sharply for 2022.
In terms of NA, the reduction, although significant – almost 23%, is not critical. The value is positive and many times greater than the authorized capital. The latter is equal to 5.2 million rubles. And this is 300 times less than the average.
The main reason for the decrease in the indicator is the payment of dividends to shareholders in the amount of about 600 million rubles. And this despite the fact that net profit in 2020 amounted to only 130 million rubles.
This shows: satisfying the interests of the owners always worsens the financial condition of the business. After all, in this case, money is taken out of circulation and stops working for the company. On the other hand, dividends increase the attractiveness of the organization to potential investors. If additional shares are issued, the demand for them will be higher.
The situation with SOS is worse than with NA. They were negative already at the end of 2019. As of December 31, 2020, they went into an even greater negative, having decreased by almost 17 times. The main reason: a decrease in current assets by 3 times, despite the fact that liabilities became lower by only 1.3.
Why did the turnover become poorer? Two factors played a major role:
- reduction of accounts receivable by almost 5 times by 513 million rubles;
- repayment by another company of a short-term loan provided to it for 368 million rubles.
Both points should be regarded as positive. Only the cash balance as of December 31, 2020 increased by only 93 million rubles. We wrote above why this is so. At least 600 million rubles. spent on paying dividends.
Debt to equity ratio
This ratio provides the most general assessment of financial stability. Shows how many units of borrowed funds account for each unit of equity:
Debt to Equity Ratio = Debt Capital / Equity Capital
Kzs = (p. 590 + p. 690 - p. 640 - p. 650) / (p. 490 + p. 640 + p. 650) form No. 1
or
Kzs = (p.590 + p.690) / p.490
Kzs = (page 1500 + page 1400) / page 1300
Analyze the change in the value of the indicator over time. The growth of the indicator in dynamics indicates the increasing dependence of the enterprise on external investors and creditors. Recommended value of Kzs <0.7. The optimal ratio of borrowed and equity funds is 0.5 < Kzs < 0.7. Exceeding the coefficient value of 0.7, i.e. Kzc >0.7 indicates that the financial stability of the enterprise is in doubt.
The higher the value of the indicator, the higher the risk level of investors, since in case of failure to fulfill payment obligations, the possibility of bankruptcy increases.
How to find it?
When calculating the ratio, the organization's balance sheet is used.
Balance calculation formula:
- Kfin. mouth = (line 1400 + line 1300)/line 1700.
Full transcript:
- Kfin. mouth = (equity + long-term liabilities)/balance sheet liabilities.
When calculating, long-term liabilities are added to the equity capital of the enterprise, since they have been at the disposal of the company for quite a long time. The recommended value of the coefficient is the indicator 0.8-0.9.
You can get detailed information about this coefficient from the following video:
Example
Let’s say organization N has 500 million rubles of its own funds + long-term loans in the amount of 300 million. The balance sheet currency is 970 million. Then the coefficient will be equal to:
- (500 + 300)/970 = 0.82
Acceptable financial stability of the company. The bank will be able to give her a loan.
At the same time, their competitors, organization M, have more own funds - 600 million rubles, but they took out long-term loans in the amount of 100 million with the same balance sheet liabilities. In this case, the indicator will be equal to:
- (600 + 100)/970 = 0.72
The financial stability of the enterprise is low.
Lenders will prefer not to contact this organization. How to correctly fill out a personal salary account - read in this article. What is a confidential information non-disclosure agreement - see here.
Ratio of mobile and immobilized assets
Shows how many non-current assets account for each ruble of current assets:
Ratio of mobile and immobilized assets = Current assets / Non-current assets
Km/i = (page 190 + page 230) / (page 290 - page 244 - page 252) form No. 1
or
Km/i = page 190 / page 290
Km/i = page 1100 / page 1200
No standard values have been established for this indicator.
Working capital coverage ratio from own sources of financing
The ratio shows whether the enterprise has its own funds necessary for its financial stability:
Working capital coverage ratio with own sources of financing = (Equity capital - Non-current assets) / Current assets
Ko = (p. 490 - p. 190)/(p. 290 - p. 230) form No. 1
Ko = (p. 1300 - p. 1100) / p. 1200
The methodological literature indicates that the enterprise is provided with its own sources of working capital financing with a coefficient value of ≥0.1.
Own funds ratio
The coefficient of provision with own working capital shows the sufficiency of the enterprise's own funds necessary to finance current (operating) activities, i.e. ensuring financial stability. This indicator was introduced normatively by the Order of the Federal Fund for Financial Affairs of August 12, 1994 No. 31-r, and is not widespread in Western practice of financial analysis.
The formula for calculating the working capital ratio is as follows:
Equity ratio = (Equity capital - Non-current assets) / Current assets
Xos = (p. 490 - p. 190) / p. 290 form No. 1
Xos = (p. 1300 - p. 1100) / p. 1200
According to the above order, the indicator is used as a sign of insolvency (bankruptcy) of the enterprise. The normal value of the equity ratio should be at least 0.1.
Basic Concepts
When determining financial stability, the following terms are used:
- Degree of independence. It can be found by establishing the ratio of different asset and liability items recorded in the balance sheet.
- Passive structure. Its analysis helps to understand the sources of a company's instability. This is extremely important, as it helps solve the problem of insolvency by eliminating negative factors. For example, these include improper management of equity capital and a large amount of borrowed funds.
- Own working capital. These are the funds that the company has the right to dispose of. The source of their formation is the resources of the organization. For example, profit from core activities.
- Borrowed working capital. These are loans, borrowings, debts to creditors, various liabilities. Most companies take out loans. However, there should not be too many of them, as this leads to dependence on creditors.
- Long-term solvency. Implies the ability to cover your obligations in the long term.
- Short-term solvency. Implies the ability to cover your obligations in the short term. In this case, as a rule, current assets are used.
- Own resources. These include share capital, retained earnings, and depreciation.
How to analyze the financial stability of companies based on bankruptcy forecasting models?
Sufficient sustainability is ensured if the company achieves maximum results with minimal expenses. Costs are reduced by optimizing the list of sources of asset formation. Pay attention to the structure of working capital. It represents the ratio of loans to equity.
Inventory coverage ratio with own funds
The coefficient of provision of material inventories with own funds is an indicator characterizing the level of financing of inventories from the enterprise’s own sources (funds).
The formula for calculating the coefficient is:
Inventory coverage ratio with own funds = Own working capital / Inventories
Goats = (p. 490 + p. 590 - p. 190) / p. 210
Goats = (p. 1300 + p. 1400 - p. 1100) / p. 1210
In practice, there is a modified method for calculating this indicator; inventories are supplemented by costs (costs in construction in progress and advances to suppliers and contractors). In this case, the formula for calculating the ratio of supply of inventories and costs with own working capital will take the form:
Goats = (Equity + Long-term liabilities - Non-current assets) / (Inventories + Work in progress costs + Advances to suppliers and contractors)
The standard value of the coefficient lies in the range from 0.6 to 0.8, i.e. the formation of 60-80% of the enterprise's reserves should be carried out at its own expense. The higher the value of the indicator, the less dependence of the enterprise on borrowed capital in terms of the formation of reserves and, consequently, the higher the financial stability of the organization.
Financial Stability Analysis: Asset Coverage Ratio
The calculation of this ratio shows to what extent the company can repay loans using its assets, that is, what share of them will be used to cover debt obligations. In the calculation, only tangible and monetary assets are used, and intangible assets are omitted. The asset coverage ratio may, in particular, be one of the factors in assessing the likelihood of bankruptcy of a company.
The calculation is carried out in three stages:
- Current liabilities minus short-term loans are identified.
- Intangible assets are subtracted from all assets, and the value of the first stage is subtracted from the resulting figure.
- The resulting value is divided by all liabilities of the enterprise, both long-term and short-term.
That is, the formula for calculating the asset coverage ratio looks like this:
Asset coverage ratio = ((Assets - Intangible assets) - (Current liabilities - Short-term loans and borrowings)) / Liabilities
Thus, if the ratio increases, it means that the company is actively borrowing. The standard indicator depends on the specifics of the enterprise, for example, in production, an indicator at level 2 is considered normal. This coefficient is analyzed in conjunction with other indicators: liquidity and solvency ratios. You should also keep in mind the difference between the book value and market value of assets.