Own working capital: economic meaning of the indicator
Own working capital (SOC) is a part of working capital generated from own sources.
The indicator characterizes the organization’s ability to pay off debts using its current assets, that is, its liquidity and solvency. Calculating the indicator of own working capital is one of the first steps in analyzing the financial condition of an enterprise. The figure shows a brief general description of own working capital. A detailed description of the indicator is given below.
What does a decrease in current assets indicate?
A decrease in current assets also indicates ambiguous changes occurring in the financial condition of the company. Let's consider the most likely cases of a decrease in each element of the structure of funds in circulation and their impact on the results of the enterprise's activities.
1. A decrease in inventories and raw materials, as well as goods and finished products, may indicate a curtailment of production, a lack of working capital, or unsatisfactory performance of the supply department. 2. A decrease in accounts receivable is generally viewed as a positive phenomenon. But it would be correct to evaluate it in connection with the volume of revenue:
- if receivables decrease along with a drop in sales, then this is a natural process, but the fact is not positive - such a joint decrease almost always indicates that the business is “slowing down”;
- if, with a decrease in receivables, revenue remains at the same level or grows, then we can conclude that the company’s settlement policy with customers has improved. This is a positive aspect.
3. A decrease in cash flows can put the enterprise in a state of insolvency and the inability to pay off its obligations on time. This fact in itself is, of course, negative. However, it is most often a consequence of the circumstances that we discussed above:
- a decrease in inventory turnover (i.e., an increase in their reporting indicators);
- deterioration in the quality of receivables (i.e., growth in receivables);
- incorrect investment policy (which can be traced by the growth in the volume of financial investments).
Own working capital: formula for calculating the balance sheet
The indicator of own working capital is a calculated indicator that depends on both the structure of assets and the structure of sources of funds. The initial source of formation of current assets is the enterprise’s own capital (line 1300 – total for section III of the Balance Sheet). In this case, the amount of the enterprise’s own working capital (SOC) is calculated using the formula:
SOS = SC - VOA
where SK is equity capital; SAI - non-current assets
Based on the balance sheet line codes, the formula looks like this:
SOS = page 1300 – page 1100
Where
- line 1300 – equity capital (total for section III of the balance sheet)
- line 1100 – non-current assets (total for section I of the balance sheet)
With this algorithm for calculating the indicator of own working capital, it is clear that equity capital is split into two parts: one part is invested in non-current assets, the second - in current assets; It is the last part that can be called own working capital.
A positive value of own working capital indicates a sufficient amount of own funds to finance non-current assets. The surplus goes to cover the company's working capital needs.
As the volume of production activity increases, this figure usually increases. The increase in own working capital in dynamics is considered as a positive trend. The main and constant source of increasing own working capital is profit. The rapid growth of the amount of own working capital compared to the growth of inventories generally improves the state of working capital.
In the absence or insufficiency of its own working capital, the enterprise turns to borrowed sources. To finance part of the non-current assets, the enterprise uses long-term liabilities (line 1400 – total for section IV of the Balance Sheet). In this situation, it is already advisable to talk about working capital, which is called synonymous with own working capital.
The difference between working capital and own working capital is that the former includes the amount of long-term liabilities.
Working capital (WC) can be calculated in two ways:
1) as the difference between the amount of equity and long-term liabilities and non-current assets:
RK = SK + DO - VOA
where RK is working capital; DO – long-term liabilities
Based on the balance sheet line codes, the formula looks like this:
RK = (p. 1300 + p. 1400) – p. 1100
Where
- line 1400 – long-term liabilities (total for section IV of the balance sheet)
2) as the difference between current assets and current liabilities:
RK = OA – KO
where ОА – current assets; KO – short-term liabilities
Based on the balance sheet line codes, the formula looks like this:
RK = page 1200 – page 1500
Where
- line 1200 – current assets (total for section II of the balance sheet)
- line 1500 – short-term liabilities (total for section V of the balance sheet)
Absolute indicators of financial stability
One of the main tasks of financial analysis is the study of indicators characterizing its financial stability. It is characterized by an excess of income over expenses, maneuvering of free funds and their effective use in the process of current (operating) activities.
Analysis of financial stability at a certain date (end of the quarter, year) allows us to determine how rationally the enterprise manages its own and borrowed capital during the period preceding this date. It is important that the composition and structure of own and borrowed sources of funds meet the strategic development goals of the enterprise, since insufficient financial stability can lead to its insolvency, that is, the lack of funds necessary for settlements with internal and external partners, as well as by the state. At the same time, the presence of significant balances of free cash often complicates the activities of the enterprise due to their immobilization into excess inventories and costs.
Thus, the content of financial stability is characterized by the effective formation and use of financial resources necessary for normal production and commercial activities. The company's own financial resources include, first of all, net (retained) profit and depreciation charges. An external sign of financial stability is the solvency of an economic entity. It expresses the company’s ability to fulfill its financial obligations arising from commercial, credit and other payment transactions.
Satisfactory solvency of the enterprise
define such formal parameters as:
- availability of free funds in settlement, currency and other bank accounts;
- absence of long-term overdue debts to suppliers, contractors, banks, personnel, the state for taxes and duties and other partners;
- Availability of own working capital (net working capital) at the beginning and end of the reporting period.
Low solvency can be random, temporary and long-term (chronic). The latter type can lead the enterprise to bankruptcy. Highest type of financial stability
— the ability of the enterprise to develop primarily through its own sources of financing. To do this, it must have a flexible structure of financial resources and the ability to attract borrowed funds if necessary, i.e. be creditworthy. An enterprise is considered creditworthy if it has the prerequisites for obtaining a loan and the ability to promptly repay the loan taken to the creditor with the payment of interest due from its own financial resources.
Using internal financial sources, the enterprise not only repays loan debt to banks and income tax obligations to the budget, but also invests funds for capital costs. To maintain financial stability, it is necessary to increase not only the absolute amount of profit, but also its level relative to invested capital or current costs, i.e., profitability. It should be remembered that high returns are associated with a significant level of risk. In practice, this means that instead of profit, the company may suffer significant losses and even become insolvent (insolvent).
Consequently, the financial stability of an economic entity
- such a state of its financial resources that ensures the development of the enterprise mainly at the expense of its own funds while maintaining sufficient solvency and creditworthiness with a minimum level of business risk.
The financial stability of a business entity is influenced by many factors
:
- the position of the enterprise in the commodity and financial markets;
- production and sale of products that are competitive and in demand among buyers;
- his rating in business cooperation with partners;
- degree of dependence on external creditors and investors;
- presence of insolvent debtors;
- the magnitude and structure of production costs, their relationship with cash income;
- the amount of paid authorized capital;
- the amount of reserve capital;
- efficiency of commercial and financial transactions;
- the state of property potential, including the ratio between non-current and current assets;
- the degree of professional training of production and financial managers, their ability to constantly take into account changes in the internal and external environment, etc.
Practical work on analyzing indicators of absolute financial stability is carried out on the basis of financial reporting data (forms No. 1 and 5).
During the production process at the enterprise there is a constant replenishment of inventories. For these purposes, they use both their own working capital and borrowed sources (short-term loans and credits). By studying the surplus or lack of funds for the formation of reserves, absolute indicators of financial stability are established.
To reflect in detail different types of sources (internal and external) in the formation of reserves, the following system of indicators is used.
1. Availability of own working capital at the end of the billing period
set according to the formula:
SOS = SK - VOA,
where SOS is own working capital at the end of the billing period; SK is equity capital (the result of section III of the balance sheet); SAI - non-current assets (result of section I of the balance sheet).
2. Availability of own and long-term sources of financing for reserves (SDI)
determined by the formula:
SDI = SK - VOA + DKZ
or
SDI = SOS + DKZ,
where DKZ is long-term loans and borrowings (the result of section IV of the balance sheet “Long-term liabilities”).
3. The total value of the main sources of reserve formation (OI)
defined as:
OIZ = SDI + KKZ,
where KKZ is short-term loans and borrowings (the result of Section V “Short-term liabilities”).
As a result, it is possible to determine three indicators of the provision of reserves with sources of their financing.
1. Surplus (+), deficiency (-) of own working capital:
∆SOS = SOS - Z,
where ∆SOS is the increase (surplus) of own working capital; Z - reserves (section II of the balance sheet).
2. Surplus (+), deficiency (-) of own and long-term sources of financing of reserves (∆SDI):
∆SDI = SDI - Z.
3. Surplus (+), deficiency (-) of the total value of the main sources of covering inventories (∆OIZ):
∆OIZ = OIZ - Z.
The given indicators of the provision of reserves with relevant sources of financing are transformed into a three-factor model (M):
M = (∆SOS; ∆SDI; ∆OIZ).
This model expresses the type of financial stability of the enterprise. In practice, there are four types of financial stability (Table 1).
Table 1. Types of financial stability of an enterprise
| Type of financial stability | 3D model | Sources of financing for inventories | Brief description of financial stability |
| 1. Absolute financial stability | M = (1, 1, 1) | Own working capital (net working capital) | High level of solvency. The enterprise does not depend on external creditors (lenders) |
| 2. Normal financial stability | M = (0, 1, 1) | Own working capital plus long-term loans and borrowings | Normal solvency. Rational use of borrowed funds. High profitability of current activities |
| 3. Unstable financial condition | M = (0, 0, 1) | Own working capital plus long-term loans and borrowings plus short-term loans and borrowings | Violation of normal solvency. There is a need to attract additional sources of financing. Restoring solvency is possible |
| 4. Crisis (critical) financial condition | M = (0, 0, 0) | — | The company is completely insolvent and on the verge of bankruptcy |
First type of financial stability
can be represented as the following formula:
M1 = (1, 1, 1), i.e. ∆SOS > 0; ∆SDI > 0; ∆OIZ > 0.
Absolute financial stability (M1) is very rare in modern Russia.
Second type (normal financial stability)
can be expressed as follows:
M2 = (0, 1, 1), i.e. ∆SOS < 0; ∆SDI > 0; ∆OIZ > 0.
Normal financial stability guarantees the fulfillment of the enterprise's financial obligations to counterparties and the state.
Third type (unstable financial condition)
set according to the formula:
M3 = (0, 0, 1), i.e. ∆SOS < 0; ∆SDI < 0; ∆OIZ > 0.
Fourth type (crisis financial condition)
can be represented in the following form:
M4 = (0, 0, 0), i.e. ∆SOS < 0; ∆SDI < 0; ∆OIZ < 0.
In the latter situation, the enterprise is completely insolvent and is on the verge of bankruptcy, since the main element of current assets “Inventories” is not provided with sources of financing.
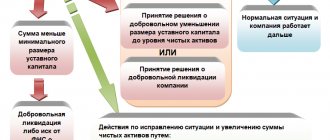
Own working capital: standard value of the indicator
A positive value of the indicator is considered normal, that is, a situation when current assets exceed short-term liabilities. A negative indicator of own working capital (working capital) negatively characterizes the financial position of the organization.
However, companies with very fast operating cycles can operate with a negative ratio. These are businesses in which inventory quickly turns into cash revenue (for example, fast food businesses).
The indicator of own working capital is also compared with the amount of the organization's reserves. Under normal conditions, this indicator should not only be positive, but also no less than the value of reserves. This is explained by the fact that inventories, as the least liquid part of working capital, must be financed from their own (and/or) long-term borrowed funds.
Why should I count KOSOS?
It is calculated to assess the financial stability of a business. If the value of the coefficient KOSOS = 1: the coefficient of provision with own working capital shows that all current assets could be purchased at one’s own expense. KOSOS = 0.01 - that only 1% of such assets are financed with their own funds. The rest were purchased with borrowed money. In the first case, the company does not depend on external financing, in the second case, it will not survive if it cannot borrow money.
It is dangerous to have a low, and even more so a negative, ratio of your own working capital. Even if you don't intend to borrow anymore. A profitable company can be bought by a creditor for next to nothing, while an unprofitable one can go bankrupt.
Let's say a company took out a loan, purchased materials with this money, and is confident that the products produced will allow it to repay the debt and earn a profit. But the bank provided covenants in the loan agreement. These are conditions that the borrower must comply with while the contract is in effect. For example, the value of return on sales, profit, debt to profit ratio. Covenants were violated - the bank demanded early repayment of the loan. We urgently need to refinance somewhere. And it’s not a fact that it will work out.
Calculation of own working capital using the example of DOK-15 LLC
The main activity of DOK-15 LLC is the production of kitchen furniture. We will calculate our own working capital without taking into account long-term liabilities using the formula:
SOS = SC - VOA
We will take the data for calculations from the financial statements of the enterprise contained in the Rosstat database.
The calculation of own working capital taking into account long-term liabilities (working capital) is presented in the material “Working Capital”.
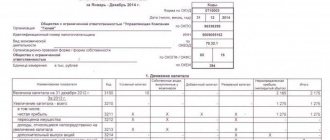
Table 1 — Balance sheet of DOK-15 LLC
Let's calculate the amount of the company's own working capital
Table 2 – Calculation of own working capital of DOK-15 LLC
| Index | Symbol | T1 | T0 | Changes | Growth rate, % |
| Fixed assets | SAI | 703278 | 355487 | 347791 | 198 |
| Equity | SK | 303428 | 87036 | 216392 | 349 |
| Own working capital | SOS | -399850 | -268451 | -131399 | 149 |
where T1 is the current (2018) year; T 0 - last year (2017)
As a result of the analysis, the following was established. Own working capital has a negative value both in the past and in the current period.
This means that the company does not have its own working capital. The operating activities of the enterprise are financed only from borrowed sources, which indicates a high level of financial risk and financial instability of the company.
Own working capital in the current period decreased compared to the previous period by 131,399 thousand rubles. and amounted to -399850 thousand rubles in 2022. versus -268451 thousand rubles. in 2022.
Factor analysis of DOK-15 LLC’s own working capital
At the next stage of the analysis, it is necessary to assess the factors of change in own working capital. This is necessary in order to identify the main reasons for the deterioration or improvement of the financial position of the enterprise. We will carry out factor analysis using the method of chain substitution. This method is universal, as it is used in all types of factor models.
Table 3 – Factor analysis of own working capital
| Index | Symbol | T1 | T0 | ± | % |
| Equity | SK | 303428 | 87036 | 216392 | 349 |
| Fixed assets | SAI | 703278 | 355487 | 347791 | 199 |
| Own working capital | SOS | -399850 | -268451 | -131399 | 149 |
| Factor calculations | |||||
| SOS0 = (SK0-BOA0) | -268451 | ||||
| SOSusl = (SK1-VOA0) | -52059 | ||||
| SOS1 = (SK1-BOA1) | -399850 | ||||
| Change due to factors: | |||||
| SK: SOSusl-SOS0 | 216392 | ||||
| VOA: SOS1 - SOSusl | -347791 | ||||
| Balance of deviations | -131399 |
Thus, own working capital in the current year compared to the previous year decreased by 131,399 thousand rubles, reaching -399,850 thousand rubles by the end of the year.
This change was the result of the following factors:
- increase in equity capital………………………+216392 thousand rubles.
- increase in non-current assets……………………- 347,791 thousand rubles.
Total -131399 thousand rubles.
Comparison of the indicator of own working capital of DOK-15 LLC and its closest competitors
The closest competitors of DOK-15 LLC are Furniture Factory Maria LLC and First Furniture Factory. We will calculate our own working capital for these enterprises and compare them with the indicators of DOK-15 LLC . Calculations were made based on the balance sheets of enterprises from the database of the Federal State Statistics Service of the Russian Federation.
Table 4 - Dynamics of changes in own working capital of DOK-15 LLC and its competitors
| Index | 2013 | 2014 | 2015 | 2016 | 2017 | 2018 |
| DOK-15 LLC | -176941 | -226231 | -167698 | -422324 | -268451 | -399850 |
| Furniture Factory Maria LLC | -137513 | -139908 | -457561 | -425640 | -369504 | -408793 |
| CJSC "First Furniture Factory" | -6543 | 15695 | 53212 | -36671 | -12208 | 110342 |
The analysis showed the following. The own working capital of DOK-15 LLC and its competitors have mostly negative values. The only exception is the enterprise CJSC First Furniture Factory, which in 2014, 2015 and 2022. this indicator had values greater than zero.
Current assets ratio
The coefficient allows you to determine the number of transfers of mobile assets into cash and vice versa. It looks like this:
Cob = B / CCOA
The following values appear in the formula:
- Cob is the coefficient that you want to find out;
- B – revenue received during the year or other period;
- CCOA is the average cost of mobile devices for the analyzed time.
It is also advisable to calculate the average cost to obtain accurate results. The calculation is carried out using the following formula:
SSOA = (SOA0 / 2 + SOA1 + SOA / 2) / (N – 1)
The formula includes the following indicators:
- SOA0 is the working balance at the beginning of the time being analyzed;
- SOA1, SOA – balance at the end of similar periods of time under consideration;
- N – number of similar intervals;
- SSOA is the average price of mobile assets that needs to be calculated.
This method takes into account seasonal changes in balances, as well as the impact of external and internal circumstances.
ATTENTION! The resulting coefficient reflects only the general condition of the enterprise. More accurate values can only be obtained by having additional data: dynamics of coefficients, comparison with standard indicators.
Calculation example
The company received revenue for the year in the amount of 1,500,000 rubles. The average cost of mobile assets is 100,000 rubles. To calculate, you need to divide revenue by average cost. As a result, we get a coefficient of 15.
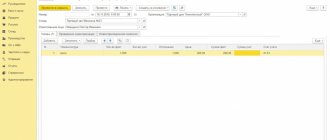
Forecasting the amount of own working capital
Analysis of the dynamics of changes in the indicator over several reporting periods allows us to predict its further changes. The figure below shows the dynamics of changes in own working capital and makes a forecast based on linear regression.
The figure shows that there is a downward trend. Moreover, the value of the indicator of own working capital throughout the analyzed period has a negative value, which indicates the financial instability of the enterprise.
What is working capital turnover?
Asset turnover is the coefficient of a company's entrepreneurial activity. It helps to assess the effectiveness of using existing assets, regardless of the sources and methods of their financing. In addition, the turnover ratio helps to keep track of the number of completed cycles of the production process for each unit of production, evaluate sales and calculate how many units of production (based on the cost of their sales) account for each unit of the company's assets.
Why do you need turnover analysis?
Turnover analysis is an assessment of indicators affecting the turnover of assets, which takes into account their involvement in the activities of the enterprise. These indicators are divided into the following groups:
- Assets are an indicator necessary to analyze the profitability of the availability and use of a company’s resources.
- Accounts receivable and payable - indicates the quality of collection of debt obligations and the ability to make payments on one’s own debt obligations.
- Fixed assets are an indicator that takes into account the total costs of an enterprise.
- Enterprise capital is needed to assess the feasibility of using borrowed funds and non-financial resources.
- Fixed assets are needed to assess the effectiveness of investments and the quality of use of existing assets for the development of the enterprise.
- Material reserves are an indicator indicating the need for reserves, as well as the feasibility and extent of their use.
Turnover analysis is performed only in dynamics. A fall indicates inefficient use of assets. Growth, on the contrary, indicates the intensity of the company's development.
Sources of own working capital and ways to increase them
Sources of own working capital include :
- authorized capital,
- profit,
- issue of securities,
- operations on the financial market,
- stable liabilities.
The main measures to increase own working capital are:
- optimization of the enterprise asset structure
- attracting additional funds from owners
- change in current dividend policy
- reinvestment of net profit
Synonyms:
- Net working capital - what the Anglo-American school of accounting and finance uses the term Net Working Capital (NWC)
- Own working capital (SOC)
- Working capital - in English the term Working capital (WC) is used.
How is SOS and their turnover calculated?
The SOS formula was established by the now inactive FSFO Order No. 31-p dated 08/12/94 and Government Decree No. 498 dated 05/20/94. According to these documents, the formula was established to assess the security of an enterprise. It was used to calculate the level of solvency of the company. The minimum indicator was considered to be a coefficient of 0.1. However, these documents have now been abolished due to the excessive rigidity of the criteria characteristic of the early policies of Russian financial legislation. At the same time, the calculation formula was established on the basis of the English version, so it is successfully used today.
How is the SOS value calculated?
The formula for calculating SOS is:
COC = OA – KO,
Where:
- COC – own working capital;
- OA – assets in circulation of the enterprise;
- KO – obligations with a short duration (less than a year).
How is OS turnover calculated?
The turnover formula looks like this:
KO = OP ÷ CCA,
Where:
- KO – fixed assets turnover ratio;
- OP – indicator of the volume of products sold during the analysis period;
- CCA is the average value of the enterprise's assets during the analysis period.
Example of quarterly calculation of SOS
Let's consider the dynamics of the solvency of the textile manufacturing company Romashka LLC in 2022 based on quarterly reporting.
| No. | Balance indicator | |
| under section II (working capital) | under Section V (current liabilities) | |
| I quarter 2022 | ||
| 1 | 835495 | 575897 |
| II quarter 2022 | ||
| 2 | 1250581 | 995167 |
| III quarter 2022 | ||
| 3 | 1398451 | 1084799 |
| IV quarter 2022 | ||
| 4 | 1189756 | 872183 |
Accordingly, the SOS was:
- SOS Q1 2022 = 835495 – 575897 = 259598;
- SOS II quarter 2022 = 1250581 – 995167 = 255414;
- SOS III quarter 2022 = 1398451 – 1084799 = 313652;
- SOS IV quarter 2022 = 1189756 – 872183 = 317573.
The above calculation shows that the amount of Romashka LLC’s own working capital is always greater than zero. In addition, since the beginning of the year the figure has increased by 57,975 rubles. Accordingly, at the end of 2017, the solvency of Romashka LLC increased.
Standard value
The cost of working capital can take on both positive and negative values. A SOS reading above zero is considered normal. More specific figures depend on the company’s field of activity, its size and the characteristics of the business. In some cases, a small excess will be enough, in others, own working capital must be above a certain level.
A negative value of own working capital (shortage) negatively affects the stable position of the company as a whole. In most cases, this leads to solvency problems. However, in some areas, the amount of working capital may be below zero, and this will be a normal situation.
Companies with a very fast operating cycle can afford a negative SOS value.
A case in point is fast food chains, which are able to turn inventory into cash in record time. Table 2. Causes of excess and deficiency
| Surplus | Flaws |
| SOS exceed the organization's inventories and costs. | SER is less than the value of inventory and expenses. |
| Part of the profit remains in circulation before it is distributed. | There is no profit left in turnover. |
Important! If a surplus occurs, it is advisable to store it in current accounts rather than keep it in inventory or pay additional expenses from working capital. In the future, this money can be used to finance higher goals (for example, expansion of production).
SOS calculation
Each enterprise calculates the absolute value of its own resources in circulation. Based on this indicator, you can come to a conclusion about the structure of the balance sheet, and, if necessary, optimize it. Provision of own working capital is determined as follows:
SOS = Assets in circulation - Short-term liabilities
Based on balance sheet data, the formula looks like this:
SOS = s. 1200 - p. 1500
This is the approach officially adopted by the “Methodological Regulations for Assessing Financial Condition”. But, based on the economic meaning of the balance sheet structure, this formula can be presented in a different form:
SOS = Own capital + Long-term liabilities – Non-current assets.
According to the balance sheet, the calculation looks like this:
SOS = s. 1300 + s. 1530 - p. 1100
The first formula is simpler for calculations, so it is most often used. But in order to understand the organization of the balance sheet structure, it is necessary to understand the essence of the second calculation.