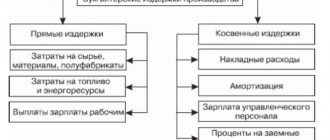
What is the tax burden
This term refers to the share of revenue paid by the enterprise to the budget. Often, based on the value of this coefficient, the tax office understands whether the business is being conducted fairly. The Federal Tax Service calculates average load values for each type of activity and publishes tables with coefficients.
Banks also use the value of the tax burden when they decide to issue a loan or service a company. If the amount of payments to the budget from the total turnover of the account is less than that established by law, then the business is considered dishonest.
Safe tax burden values in 2022
These values change every year and are published by the Federal Tax Service in accordance with statistical reporting data. Below is a table with the coefficients that tax authorities use in 2020.
Until mid-2022, tax authorities use indicators for 2019, and only by mid-year will new data collected for 2022 be calculated. Below is a table with the current coefficients that the Federal Tax Service currently uses.
| Type of economic activity (according to OKVED-2) | The tax burden, % | For reference: fiscal burden for the North, % |
| TOTAL | 11,2 | 3,5 |
| Agriculture, forestry, hunting, fishing, fish farming - total | 4,5 | 5,2 |
| crop and livestock farming, hunting and provision of related services in these areas | 3,4 | 4,8 |
| forestry and logging | 8,7 | 7,6 |
| fishing, fish farming | 10,1 | 6,0 |
| Mining - total | 41,4 | 1,7 |
| extraction of fuel and energy minerals - total | 50,9 | 1,1 |
| extraction of mineral resources, except fuel and energy | 11,4 | 3,6 |
| Manufacturing industries – total | 7,6 | 2,1 |
| production of food, beverages, tobacco products | 20,9 | 2,1 |
| production of textiles, clothing | 8,0 | 4,3 |
| production of leather and leather products | 10,0 | 5,3 |
| wood processing and production of wood and cork products, except furniture, production of straw products and wicker materials | 1,6 | 3,6 |
| production of paper and paper products | 4,8 | 1,9 |
| printing and copying activities | 8,9 | 3,8 |
| production of coke and petroleum products | 4,2 | 0,2 |
| production of chemicals and chemical products | 3,0 | 2,3 |
| production of medicines and materials used for medical purposes | 6,9 | 3,1 |
| production of rubber and plastic products | 6,9 | 2,8 |
| production of other non-metallic mineral products | 9,3 | 3,4 |
| metallurgical production and production of finished metal products, except machinery and equipment | 4,0 | 2,1 |
| production of machinery and equipment, not included in other groups | 9,9 | 4,4 |
| production of computers, electronic and optical products | 11,7 | 5,1 |
| production of electrical equipment | 7,5 | 3,3 |
| production of other vehicles and equipment | 6,5 | 4,7 |
| production of motor vehicles, trailers and semi-trailers | 5,8 | 1,5 |
| Providing electricity, gas and steam; air conditioning - total | 7,1 | 2,4 |
| generation, transmission and distribution of electricity | 8,3 | 2,1 |
| production and distribution of gaseous fuels | 1,3 | 1,7 |
| production, transmission and distribution of steam and hot water; air conditioning | 7,1 | 10,0 |
If an enterprise is engaged in several types of activities, then you need to focus on the tax burden for the one indicated as the main one. In the event that a company has moved to work in another industry, it is necessary to promptly enter data about this into the Unified State Register of Legal Entities. If the activity of an enterprise does not fall under any of the types indicated in the list above, then you need to look for values for the closest one in your industry.
“It’s impossible to work the old way.” What do entrepreneurs say about the growing tax burden?
According to the Federal Tax Service, the total tax burden on the economy has increased, but the fiscal burden on insurance premiums, on the contrary, has decreased
Submitting documents to the Federal Tax Service inspectorate. Photo: Dmitry Feoktistov/TASS
The tax burden on the Russian economy is growing. Data from the Federal Tax Service indicate its increase in 2022 compared to the previous year.
As RBC notes, the total tax burden on the economy increased by 0.2 percentage points, to 11%. But the fiscal burden on insurance premiums, according to estimates by the Federal Tax Service, on the contrary, decreased - from 3.6% to 3.3%.
There is a big difference in the tax burden in different areas. The pressure on mining has increased the most (although the extractive industries have the highest profitability). The second place in terms of tax burden is in the sphere of real estate transactions. Administrative activities are also among the leaders: travel and recruitment agencies, support services for business, and building maintenance.
Business FM asked business representatives from different areas whether they are seeing an increase or decrease in the tax burden.
Oleg Filippov, general director of construction “The total tax burden declared by Rosstat, according to the surveyed enterprises and my group of companies directly, does not correspond to the declared 34-35% of the total tax burden. On average, according to practical calculations, according to management accounting data of small and medium-sized enterprises that form the core, the so-called starting economy in both Russia and the world ranges from 45% to 47%. This is in practice. Therefore, although the tax inspectorate declares a reduction in fiscal contributions as opposed to, say, an increase in VAT, in fact, practice suggests that, in general, the actual tax burden is growing.”
It’s not possible to work the old way, says Alexey Petropolsky, owner of the Take&Wake coffee shop chain.
Alexey Petropolsky, owner of the Take&Wake coffee shop chain “Of course, [the tax burden] has increased. And this does not lie in some direct or indirect taxes that have been increased somewhere. This is primarily reflected in how the tax office itself works. She begins to check each of your counterparties, sends out some letters every quarter after the camera room to provide explanations on certain counterparties. And if the tax office is not satisfied with these clarifications, it unilaterally charges VAT, sometimes a fine and penalties. The collection rate has really increased, and it’s not possible to work as before, you have to filter each counterparty and, before concluding a contract for some basic advertising, thoroughly study the company with which you are concluding a contract, and, if it does not suit 25 parameters, you have to refuse and look for another one, because there is a high probability that the services of this company will cost you 20% more.”
To stay afloat, you have to make sacrifices, admits the president of the group that produces workwear, Yuri Savelov.
Yuri Savelov, president of the group “Over the past three or four years, the tax inspectorate, led by Mishustin, has brought order, we all began to pay taxes. Everything has become so transparent that tax evasion is very fraught for an entrepreneur. In our particular business, the tax burden is very strong. We have to reduce turnover, we have to reduce staffing - I mean people, in order to somehow get within the limits and have at least some profit. Our income tax is now low - 13%. Really small, if you take it on a global scale by country. But profit must be earned. It's not so easy to earn it now. And VAT is 20%, which you have to pay immediately.”
As RBC notes, the Ministry of Finance calculates the tax and fiscal burden as the sum of all tax receipts and mandatory non-tax payments to the budget system as a percentage of GDP. The data for 2022 is known - approximately 31%. In this case, the tax burden in Russia is comparable to countries such as the UK, Canada, and New Zealand. But in the USA and Switzerland the figure is lower - 26-27%.
Add BFM.ru to your news sources?
How to calculate the tax burden
First of all, you need to understand what exactly to take for calculation. According to the latest instructions from tax authorities:
- revenue is taken without excise duties and VAT;
- insurance premiums are excluded from the calculation;
- income is taken from line 2110 of the annual income statement;
- The amount of taxes includes the personal income tax paid.
The tax burden coefficient is calculated using the formula:
Tax burden = Amount of taxes paid / Income * 100.
Calculation example
From the tax return of the machine-building enterprise it follows that the company paid taxes in the amount of 850,000 rubles last year. At the same time, insurance premiums amounted to 330,000 rubles. The company's revenue is 9.5 million rubles. (without VAT). Let's calculate the existing tax burden:
850 000 / 9 500 000 * 100 = 8,94.
The burden of insurance premiums is equal to:
330 000 / 9 500 000 * 100 = 3,47.
Now we need to compare the obtained values with industry averages. For mechanical engineering, the total burden is 9.9, and for insurance premiums – 4.4. We can summarize that this company pays less taxes than the average company in this industry. Therefore, the business is under the close attention of the fiscal authorities - the enterprise may be included in the plan of on-site tax audits or an explanation from the Federal Tax Service will be required.
We consider the effectiveness of tax planning
Check for savings
The percentage of savings that you receive by applying the scheme developed during the tax planning process (as well as savings from the tax system that has already developed in the company in practice) can be calculated using the following formula:
Ke = amount of taxes accrued for the period / volume of products sold for the period x 100%
,
where Ke is an indicator of the company’s tax savings. It can be calculated both for the year and for each reporting period.
The amount of taxes accrued for the period should include not only those amounts that you yourself calculated, but also the amounts additionally assessed during this period by the tax office (including penalties and fines). Let's summarize the results:
– if your company’s tax savings for the reporting period are 20–25 percent (and remain at this level for several periods in a row), then your tax planning system is working effectively and does not need adjustment. The company can limit itself to analyzing changes in laws in order to adjust its actions in a timely manner and avoid risks.
– 25–40 percent indicate that the system is not working effectively enough. The situation can be corrected using internal reserves (through the accounting department) or attracting a tax consultant to identify weak points and correct them.
– 40–70 percent – the tax plan itself requires adjustment. It is necessary to analyze the legislation again (it is best in this case to involve specialists) and draw up a new scheme.
– if your indicator is more than 70 percent, the question arises: why run such a business, isn’t it better to do something else?
Let us explain with an example: for example, if at the end of the first half of 2005 the volume of products sold was 120,878,128 rubles, and the amount of accrued taxes was 29,818,210, then the percentage of tax savings will be:
RUB 29,818,210 / RUB 120,878,128 x 100% = 24.66%.
This means that the company is operating efficiently and its tax action plan does not need to be adjusted.
Check for effectiveness
There are also separate indicators of the effectiveness of tax planning.
Group 1 – indicators that allow you to obtain a general characteristic of the effectiveness of the methods and schemes that you have chosen.
En – tax efficiency coefficient.
En = planned amount of net profit / total amount of tax payments
The higher the coefficient, the better (after all, the indicator will increase if, as a result of optimization, the company pays less taxes than, say, last year or than planned at the beginning of the year).
The tax intensity of sold products is also quite an interesting issue. The share of tax payments is calculated using the formula:
Dn = amount of tax payments / volume of products sold.
So, if you paid 300 thousand taxes in a year (of which 50 thousand are additional accrued amounts, penalties and fines), the sales volume of which was 1,400,000 rubles, then the tax intensity coefficient is 0.2. But if the company had approached the tax process competently and, perhaps, additional amounts would not have been accrued, then with a tax amount of 250 thousand rubles, the coefficient would have been 0.17. In other words, in this case, the opposite is true - the lower the indicator (compared to previous periods), the more successfully you have optimized the company’s tax process.
Group 2 – these are private indicators characterizing the share of groups of tax payments, for example, in the price of products and in profit.
So, let Kc be the price taxation coefficient.
Kc = the amount of tax payments included in the price of the product (for example, VAT, excise taxes) / price of the product
Кп – profit taxation coefficient.
Кп = amount of tax payments paid from gross profit / amount of gross profit
The principle of calculation is the same: the ratio of the part and the whole. This means that the lower the coefficients, the better for the company. The smaller part of the price or profit it transfers to the budget. And the more she will have at her disposal.
Group 3 – indicators of the effectiveness of using tax benefits. They are also calculated quite simply:
L1 – preferential taxation coefficient,
L1 = tax savings as a result of benefits / amount of liabilities excluding benefits.
This formula can be used both when choosing a particular benefit (that is, calculated for the expected savings), and based on the results of work. Compare the indicators. The closer the coefficient is to one, the better. If this indicator is very low, then it is better not to use the benefit - there is too little sense, and there is a basis for a more thorough check by inspectors. In this case, it is best to decide whether this benefit is needed at all.
L2 – benefit efficiency coefficient.
L2 = tax savings as a result of using benefits / total sales volume
It is also better to calculate this indicator both before and after using the benefit.
The higher the score, the better. If at the end of the year the figure decreases compared to the one we planned (or the one we had last year), we need to think about whether the benefit is being used correctly and whether it is needed.
And finally
Using the last formula, you can calculate the overall tax efficiency of the region in which you operate:
Er = volume of revenue from sales of your company (for the period) / total amount of tax liabilities in the region (for the same period).
The last formula seemed very interesting to us, and we asked our readers, accountants of companies from the Volga region and the Urals, to calculate the tax efficiency of their region based on the results of 2004.
Thus, for a company operating in one of the regions in the Urals, with revenue of 197,455,809 rubles, the total tax amount was 42,142,178 rubles:
Er = 197,455,809 rub. / RUB 42,142,178 = 4.69.
A company from the Volga region has the following result:
with revenue of 223,451,988 rubles, taxes - 60,785,401 rubles, total:
Er = 223,451,988 rub. / 60,785,401 rub. = 3.68
(the efficiency coefficient turned out to be lower).
This example shows that such an analysis is a fairly simple way to determine at least approximately the attractiveness of a particular region. And take this into account both when analyzing the company’s performance and when deciding on the location of a new branch.
Alena ANDROPOVA, Liliya IZOTOVA
electronic edition of 100 ACCOUNTING QUESTIONS AND ANSWERS BY EXPERTS
A useful publication with questions from your colleagues and detailed answers from our experts. Don't make other people's mistakes in your work! The latest issue of the publication is available to berator subscribers for free.
Get the edition
Calculation formulas for different types of taxation
The tax office calculates the burden for each enterprise separately, depending on the type of taxation and type of taxes. Let us consider in more detail the calculation methods for each particular case.
For organizations on OSNO
Tax burden = (Amount of VAT payable to the budget + Amount of income tax calculated for payment) / Revenue * 100,
Where:
- the VAT amount is taken from page 40, section. 1 VAT declaration;
- tax amount - from page 180, sheet 2 of the income statement;
- revenue - from line 2110 of the financial statements.
For individual entrepreneurs on OSNO
Tax burden = personal income tax / Total taxable income * 100,
Where:
- Personal income tax is taken from page 40, section. 1 declaration 3-NDFL;
- amount of income - from page 60, section. 2 declarations 3-NDFL.
For individual entrepreneurs and organizations on the simplified tax system
Tax burden = Amount of tax transferred / Amount of income received * 100,
Where:
- the tax amount is taken from page 133, section. 2.1.1, 2.1.2 and pp. 273, 280, sec. 2.2 declarations according to the simplified tax system;
- amount of income - from page 113, section. 2.1.1, 2.1.2 and page 213, sec. 2.2 declarations according to the simplified tax system.
For individual entrepreneurs and organizations on the Unified Agricultural Tax
Tax burden = Amount of calculated tax / Amount of income received * 100,
Where:
- the tax amount is taken from page 50, section. 2 declarations on Unified Agricultural Tax;
- the amount of income is taken from page 10, section. 2 declarations under the Unified Agricultural Tax.
If an enterprise has obligations to pay transport, water and land taxes, excise taxes, mineral extraction tax, and use of resources, then these are also included in the calculation.
Other calculation methods
Taxpayers have the right to use other methods for calculating the tax burden to conduct an independent audit. So, officials have provided two ways.
Method No. 1. Calculation of income tax.
To calculate the amount of the fiscal burden, you will need data from the income tax return for the final period (calendar year). Only two indicators are needed:
- sheet 02, line 180;
- sheet 02, sum of lines 010 and 020.
So, you can calculate the income tax burden using the formula:
Currently, the values by which the Federal Tax Service initiates an on-site inspection have not been established. The indicators for previous years were as follows: at least 1% for a trading company, and at least 3% for other organizations, including contracting companies and manufacturing enterprises.
Method No. 2. Calculation of value added tax.
With this method of calculating the fiscal burden, the ratio of the amount of VAT deductions to the amount of accrued tax is calculated. If the obtained value is 89% or more, then the Federal Tax Service will be interested.
IMPORTANT!
Low values of VAT payable amounts cannot indicate that the taxpayer is deviating from paying taxes and fees. This conclusion can only be drawn based on the results of the verification.
VAT burden
For companies using this type of tax, the fiscal service also calculates the share of deductions using the following formula:
Share of deductions = Total amount of deductions / Total amount of accrued VAT * 100%,
Where:
- the amount of deductions is taken from line 190, section. 3 VAT returns;
- VAT amount – from line 118, section. 3 VAT returns.
If the result of the calculations is more than 89%, then the enterprise will be classified as a risk group, so before each submission of a declaration it is worth checking the proportion of VAT deductions. In case of excess, it is better to transfer part of the deductions to the future or leave them as they are and prepare answers to questions from tax authorities and supporting documents.
Tax burden for VAT: concept and regulatory framework
Before filing a return, tax authorities recommend checking the data and calculating the tax burden yourself.
Indicators to pay attention to:
- The significance of VAT claimed for deduction as a ratio to the tax base. It cannot be equal to or higher than 89%.
- Tax obligations of a company paying VAT. This indicator is not defined by letter. But if we draw an analogy with the profit burden of an enterprise, then it should not be lower than 3% for manufacturing companies and 1% for trading enterprises.
Personal income tax burden
The calculation of the tax burden for personal income tax is determined by the formula:
Tax burden for personal income tax = Calculated personal income tax / Total amount of income from this activity * 100%.
The tax office will require an explanation if the resulting value is too low. For legal entities, an important indicator here will be the dynamics of payments; the Federal Tax Service will pay close attention to the company if:
- Personal income tax amounts decreased relative to previous periods by more than 10% based on the results of the quarter or year.
- Based on the amount of personal income tax, it was revealed that the company pays wages below the regional average.
- The amounts of insurance premiums are also reviewed to see if they have decreased with the same number of employees.
How to control your tax burden
When preparing scheduled audits, tax officials primarily include the following companies:
- working with negative profitability indicators;
- with a large share of deductions for personal income tax or VAT;
- with a reduced level of burden on basic contributions corresponding to the chosen taxation system;
- with tax debts;
- with reduced amounts of contributions to the budget compared to previous years;
- applying unjustified benefits for paying taxes.
All these factors lead to the fact that the fiscal service begins to doubt the “conscientiousness” of the enterprise and an official request is sent to the manager demanding an explanation for the discrepancies. If the answer is unclear or does not correspond to the real state of affairs, then verification cannot be avoided.
On the other hand, the analysis must also be carried out within the enterprise in order to timely detect problems with tax policy and identify its irrationality. In this case, it will be possible to carry out a number of measures that adjust the tax base while planning the tax burden. This can be done personally by the manager or chief accountant under the control of the business owner.
It will be necessary to carefully ensure that the tax burden is not less than 1% of the industry average. The coefficient may be higher than that specified by the Federal Tax Service, but this will mean that the company is overpaying taxes. To plan the burden of contributions to the budget, you need to:
- check the current required level of tax burden;
- plan the load for each type of tax and for the enterprise as a whole;
- determine the methods by which the intended result can be achieved;
- monitor the completion of the task and periodically make calculations independently.
- A timely change in tax policy will allow you to avoid an on-site audit by tax authorities.
How to explain the low tax burden
Almost every newly opened enterprise will have a level below that required by law. Typically, fiscal services take into account the date of creation of the company during each document check, but it may be necessary to provide additional clarification to the Federal Tax Service.
It will be more difficult for those companies that have been operating for more than one year, and the tax burden has recently decreased. In this case, most often the reason is indicated by activities under several OKVED - tax authorities often use only the main type of economic activity for calculations, so the data may be overestimated. In this case you can:
- change the main OKVED code and inform the fiscal service that you have worked according to it before - this is not prohibited by law;
- independently calculate the tax burden separately for each type of company activity.
Recalculation of the load can also be useful in terms of checking whether personal income tax was included in the calculation of the tax burden. The Federal Tax Service often forgets about this tax, and the result is an overestimated figure.
If all values are calculated correctly, then the company can explain its underestimated tax burden ratio as follows:
- Not only production activities are carried out, but there are also investment investments;
- a lot of effort is aimed at developing the production (or trade) network;
- the development of a new type of activity has begun (suitable for companies that have been operating for several years).
You can also point out to tax officials data from statistics for a specific region and industry that during this period there were objective reasons for the deterioration of affairs. This could be a decline in the area of business activity or in a related area where the main buyers are located, etc. For example, the following objective circumstances for reducing the tax burden are often indicated:
- decrease in product sales volumes;
- a strong increase in the cost of raw materials from suppliers;
- increase in administrative expenses, employee salaries, and other costs.
All data must be supported by reports from previous periods, where everything was in order and the tax burden was higher. Then it will be clear that the company is really facing problems at this time, which resulted in a decrease in transfers to the budget.
Regions under attack
Tax policy in the fuel and energy sector must be long-term and stable in order to maintain investor interest and support regional development. “It is impossible not to admit that the stability of tax legislation is a guarantee for guaranteed investments, and primarily in oil production and petrochemicals, and the fact that the government was forced to change the already adopted rules of the game - certain companies mainly suffered,” said the vice - Prime Minister Yuri Borisov. “The effect on different companies is different, and the losers to a greater extent are producers who used the exemption for the production of heavy, high-viscosity oil, since it ceases to exist,” says Maxim Nechaev, director of consulting in Russia at IHS Markit. “If the production of such oil is suspended, then it will be very difficult to increase it again in the future.”
According to Yuri Borisov, in a crisis it is necessary to look for measures to maintain investment attractiveness and spend more in order to quickly get out of the crisis situation. “For me, as an industrialist, this is obvious, because if we reduce budget expenditures this year, then the collection in subsequent years will not increase,” Borisov continued. He expressed the hope that the proposed tax changes are “short-term firefighting measures.” “If we restore our economy, it will be possible to quickly return, from 2021-2022, back to more interesting mechanisms that will provide preferences to our leading companies so that they more dynamically develop market segments,” the Deputy Prime Minister concluded.
The situation is really complicated. “On the one hand, the withdrawal of about 300 billion rubles per year from the industry in the context of OPEC+ and low prices has very negative consequences for the industry in terms of the ability to finance new projects. On the other hand, the budget now urgently needs resources to fulfill increased social obligations due to the pandemic,” comments Daria Kozlova, director of consulting in the field of state regulation of the fuel and energy complex at VYGON Consulting. — To maintain the status quo, it would be right to introduce additional incentives for new investments in the industry starting in 2023 after the completion of OPEC+ and when the market stabilizes. Moreover, this must be done now, since the investment planning cycle in the oil industry is at least five years old, which means investors must be confident in the future now.”
Yuri Borisov
Photo: Ramil Sitdikov / RIA Novosti
The heads of the “oil-producing” regions also noted that changes in the tax regime for the industry could negatively affect the socio-economic development of the regions. “On the regional side, we do everything. But I think now is the most responsible time, primarily on the part of the federal government, to pursue a stable long-term tax policy, perhaps in exchange for investment. Because investing in energy can only be done with the understanding that the rules of the game will be long-term,” noted Governor of the Tyumen Region Alexander Moor.
In turn, the governor of the Yamalo-Nenets Autonomous Okrug, Dmitry Artyukhov, called the news on the change in the income tax “a strong blow to the industry” and pointed out that such tax changes would negatively affect the oil and gas industry and, as a result, the development of the region. He fears that oil companies will soon begin to curtail plans and cut teams.