What is a financial result?
Financial result is the economic result of the economic life of an organization, which is expressed in the form of profit or loss.
Profit is the amount by which revenue received exceeds expenses incurred. Simply put, when the company remains “in the black”. When an organization has incurred more expenses than it has earned from its activities, it is said to have received a loss. Information about financial results is important not only for internal control and management, but also for external parties interested in information of this kind. These include banking organizations that issue borrowed resources for the use of the company at certain interest rates, insurance companies, property insuring organizations, investors investing in the development of the company, and others. Profit is a relative measure of a company's performance. In general, it symbolizes the positive result of the enterprise. But based on profit analysis, different conclusions can be drawn. For example, after conducting a comparative analysis of profits over several years, a specialist can make a conclusion about an increase or decrease in its value and an increase or decrease in the efficiency of the company.
The resulting loss signals the company's management about the inefficiency of commercial activities and the need to take measures to increase the company's profitability.
For effective analysis, it is important to organize timely and accurate accounting of the financial results of the organization.
Financial result from ordinary activities in accounting
The types of activities that are fixed in the constituent documentation can be classified as ordinary. Account 90 is intended for recording financial results. It is more convenient to maintain “ordinary” income and expenses in subaccounts opened to it:
- 1 - “Revenue”.
- 2 - “Cost of sales”.
- 3 - “VAT” (sales or “output” VAT).
- 4 - “Excise taxes”.
- 9 — “Profit/loss from sales.” It is in this subaccount that the final result of accounting for financial results is summarized.
Accounting for financial results from the normal activities of an organization can be represented by the following accounting entries:
- Dt 62 Kt 90.1 - sales revenue accrued;
- Dt 90.3 Kt 68 - VAT charged;
- Dt 90.2 Kt 20 (41, 43, 44) - reflects the cost of products, works or services.
Read about the features of accounting for production expenses in our article “Main production in the balance sheet (nuances).”
How to determine whether a company has made a profit or a loss? To do this, you need to compare the total turnover on the debit of accounts 90.2, 90.3, 90.4 with the turnover on credit 90.1. If the credit of the account 90.1 is greater than the debit turnover, then the company can record a profit: Dt 90.9 Kt 99. If the result is the opposite, then they speak of a loss received: Dt 99 Kt 90.9. Note that at the end of the reporting period there should be no balance on account 90.
What is the result of the company's work?
This indicator depends on the volume of sales of goods/services, the productivity of the company's property, income from transactions not related to sales and many other indicators. The financial result can be expressed as follows: the company receives either income or loss. Therefore, the activities of the enterprise are considered as:
- Profitable if the income received covers the costs incurred;
- Unprofitable when costs (production and other) exceed income.
However, they begin to analyze the company’s activities after they have already received the results of the work. We will look at how to calculate the financial result.
Accounting for financial results from other activities of the organization
If income and expenses cannot be attributed to ordinary activities, then in this case the concept of “Other types of activities” is provided for them. The list of other income consists of:
- income from the provision of property for rent;
From January 2022, lease transactions are accounted for in accordance with FAS 25/2018, approved by Order of the Ministry of Finance of Russia dated October 16, 2018 No. 208n. You can start applying the Standard earlier by reflecting this fact in the accounting (financial) statements
How to take into account financial leases in accounting and accounting when applying FAS 25/2018, find out in the Ready-made solution from ConsultantPlus. If you don't have access to K+, get a trial demo access for free.
- financial benefits from securities and other investments;
- proceeds from the sale of own assets (for example, fixed assets, intangible assets);
- gratuitous economic benefits;
- fines, penalties and penalties due, as well as compensation for damage caused;
- positive exchange rate differences;
- written off accounts payable after the expiration of the statute of limitations;
- inventory surplus, etc.
The list of other expenses is similar to income:
- cost and expenses related to the sale of assets;
- VAT on sales transactions;
- compensation for damage to third party contractors;
- fines, penalties and penalties intended for payment;
- commission of credit companies for settlement transactions;
- accounts receivable after the expiration of the statute of limitations;
- negative exchange rate differences;
- economic benefits from received loans and borrowings and others.
Others also include income and expenses arising as a consequence of emergency circumstances of economic activity: natural disaster, fire, accident, nationalization, etc. (extraordinary income and expenses).
To account for financial results from other activities, account 91 “Other income and expenses” was approved. Unlike account 90, it is enough to open only 3 subaccounts:
- 1 - “Other income”;
- 2 - “Other expenses”;
- 9 - “Balance of other income and expenses.”
The credit of account 91.1 reflects the income from other activities. It can be in correspondence with various accounts (depending on the source of income):
- Dt 62 (76) Kt 91.1 - rent accrued;
- Dt 62 (76) Kt 91.1 - accrued proceeds from the sale of assets (for example, fixed assets, intangible assets);
- Dt 62 (76) Kt 91.1 - accrued dividends, interest and other income on securities, as well as from participation in the authorized capital of third-party companies;
- Dt 66 (67) Kt 91.1 - interest accrued on previously issued long-term and short-term loans and borrowings;
- Dt 98 Kt 91.1 - income from property received free of charge is reflected;
- Dt 60 (62, 76) Kt 91.1 - accounts payable with an expired statute of limitations are written off;
- Dt 52, 57 Kt 91.1 - a positive exchange rate difference was identified when selling currency;
- Dt 63 Kt 91.1 - the amount of the reserve for doubtful debts is included in other income;
- Dt 50, 10, 41, 43 Kt 91.1 - surpluses were identified based on the results of the inventory;
- Dt 10 Kt 91.1 - materials suitable for further use remaining after damaged fixed assets, goods, finished products are capitalized;
- Dt 76 Kt 91.1 - reflects the amount of insurance compensation for destroyed property if it was insured.
And the debit of account 91.2 is intended to reflect expense transactions:
- Dt 91.2 Kt 01.2 - the residual value of fixed assets intended for sale is written off;
- Dt 91.2 Kt 04.2 - the residual value of intangible assets intended for sale is written off;
- Dt 91.2 Kt 10 - the cost of materials intended for sale is written off;
- Dt 91.2 Kt 68 - VAT is charged on transactions for the sale of fixed assets, intangible assets and materials;
- Dt 91.2 Kt 66 (67) - interest accrued on short-term and long-term loans and borrowings received;
- Dt 91.2 Kt 60 (62, 76) - expired accounts receivable written off;
For more information about the procedure for writing off receivables, read our material “The procedure for writing off receivables.”
- Dt 91.2 Kt 76 - bank commission charged for conducting settlement transactions;
- Dt 91.2 Kt 52, 57 - negative exchange rate difference is reflected;
- Dt 91.2 Kt 01.2, 10, 41, 43 - the residual value of fixed assets, materials, goods and finished products that were damaged as a result of an emergency, for example, in a fire in the warehouses of an enterprise, is written off.
The meaning of calculating the final financial result is completely similar to account 90:
- Dt 91.9 Kt 99 - profit on other operations is reflected;
- Dt 99 Kt 91.9 - loss received from other activities.
Like the score 90, the score 91 assumes there is no balance on it.
Read about the procedure for determining exchange rate differences in our article “Accounting for foreign exchange transactions (PBU, postings).”
Express analysis of the financial condition of the enterprise
Express analysis of the financial condition of an enterprise involves identifying shortcomings in the management of financial and economic activities in order to identify problem areas in the functioning of the enterprise. To do this, it is necessary to obtain an objective and accurate picture of the financial condition and financial performance of the enterprise.
Let's consider the most common areas of financial analysis based on the results of the calendar year.
Analysis of the financial stability of the enterprise
In international practice and currently in the practice of progressive Russian companies, a relative assessment of the financial stability of an organization is carried out using a system of financial ratios.
There are a lot of such ratios; they reflect different aspects of the state of the assets and liabilities of the enterprise.
- Own funds coverage ratio (ECSR):
KOSS = (SK – VA) / OA,
where SK is equity capital (line 1300 f. 1);
OA - current assets (line 1200 f. 1);
VA - non-current assets (line 1100 f. 1).
If the value is <0.1, the balance sheet structure is considered unsatisfactory and the organization is considered insolvent. A higher value of the indicator (up to 0.5) indicates the good financial condition of the organization and its ability to pursue an independent financial policy.
- Inventory coverage ratio with own funds (KOMZ):
KOMZ = (SK – VA) / ZZ,
where ZZ - inventories and costs (line 1210 + 1220 f. 1).
If the amount of material reserves is significantly higher than the justified need, then own working capital can cover only part of the material reserves, i.e. the indicator will be less than one.
- The coefficient of maneuverability of equity capital (CMC) shows the amount of own working capital per one ruble of equity capital:
KMK = (SK – VA) / SK.
- The coefficient of maneuverability of own working capital (KMO) reflects the ability of the enterprise to maintain the level of its own working capital and replenish working capital, if necessary, from its own sources:
KMO = (FV + DS) / (SC – VA),
where FV is financial investments (line 1240 f. 1);
DS - cash (line 1250 f. 1).
- The financial risk coefficient (debt-to-equity ratio; CFR) shows how much borrowed funds the company has raised per ruble of its own:
KFR = (DO + KO) / SK,
where DO - long-term liabilities (line 1400 f. 1);
KO - short-term liabilities (line 1500 f. 1)
The growth of the indicator in dynamics indicates that the enterprise’s dependence on funds raised from outside and creditors is increasing, i.e., financial stability is decreasing, and vice versa. The optimal value of this coefficient is less than or equal to 0.5.
- The autonomy coefficient (financial independence; Ka) characterizes the enterprise’s independence from borrowed capital:
Ka = SC / VB,
where VB is the balance sheet currency (line 1700 f. 1).
The higher the value of this ratio, the more financially stable the enterprise, the less it depends on borrowed funds.
- The debt ratio (financial tension index; Kd) reflects a decrease or increase in financial stability depending on the share of borrowed funds in the balance sheet currency:
Kd = (DO + KO) / VB.
Example 1
The results of calculations of the relative indicators of financial stability presented above are in table. 1. Let's analyze the obtained values.
When assessing calculated indicators, special attention is always paid to those coefficients whose values do not meet the standards. In our example, these are the coefficients of financial risk, autonomy and debt.
The value of the financial risk coefficient exceeds 1 (normative value), which indicates that the enterprise's volume of borrowed funds exceeds the volume of its own funds.
For your information
The higher the risk coefficient, the higher the probability of bankruptcy of the enterprise. However, if the rate of circulation of receivables is higher than the rate of turnover of material working capital, there is no reason to talk about imminent bankruptcy.
The coefficients of autonomy and debt are strongly interrelated, these calculated indicators add up to 1. The discrepancy between the calculated coefficient values and the standard values indicates the enterprise’s dependence on borrowed sources of financing. The ideal option is when equity capital has the largest share in the balance sheet currency.
______________
Analysis for compliance/non-compliance with standard values may be too superficial and not reflect the real state of affairs. For example, an enterprise raised borrowed funds to implement an investment project. At the same time, a high proportion of borrowed sources of financing will not necessarily indicate a poor financial condition, especially without analyzing the payback of the project itself.
Analysis of the solvency and liquidity of the enterprise
A distinctive feature of a reliable and sustainable enterprise is its ability to meet its obligations on time and in full. Moreover, regardless of the stage of the life cycle at which the enterprise is located, management must determine the optimal level of liquidity. For this, the following main coefficients are calculated:
- The absolute liquidity ratio (ALR) (the rate of cash reserves) is defined as the ratio of cash and financial investments to the amount of short-term debts of the enterprise:
CAL = (DS + FV) / KO.
The standard value is above 0.1–0.2.
- The quick (quick) liquidity ratio (CLR) is calculated as the ratio of cash, financial investments and accounts receivable to short-term liabilities:
KBL = (DS + FV + DZ) / KO,
where DZ is accounts receivable (line 1230 f. 1).
The standard value is above 0.7–0.8.
- Current liquidity ratio (CTL, total debt coverage ratio) - the ratio of the total amount of current assets to the total amount of short-term liabilities:
KTL = OA / KO.
The standard value is above 1–2.
Note!
Insufficient liquidity of assets can lead to insolvency or bankruptcy of the enterprise, and excessive liquidity can lead to a decrease in profitability.
Example 2
Let's calculate the values of liquidity indicators and summarize the results. Let’s take the initial data from the first example, provided that the company’s long-term liabilities are equal to 0 and accounts receivable are 1,796.50 thousand rubles:
- CAL = 6305.75 / 8685.25 = 0.73;
- KBL = (6305.75 + 1796.50) / 8685.25 = 0.93;
- KTL = 12,794.75 / 8685.25 = 1.47.
As we can see, all indicators exceed the minimum acceptable standard value.
The level of the absolute liquidity ratio shows what part of short-term liabilities can be repaid using available cash. In our case, 73% of short-term liabilities are due daily.
The quick liquidity ratio characterizes the company's ability to repay current short-term obligations using current assets. The calculated indicator (0.93) exceeds the standard value (0.7–0.8). This means that the company can pay off short-term obligations at the expense of quickly realizable assets.
The current ratio gives an overall assessment of the liquidity of assets. The calculated indicator (1.47) indicates that current assets exceed short-term liabilities by almost 1.5 times, i.e., a reserve stock is provided to compensate for losses.
Thus, an analysis of the liquidity of the enterprise under study indicates its high solvency, its ability to repay its payment obligations with cash resources in a timely manner.
________________________
Analysis of profitability indicators
In order to objectively evaluate the activities of any enterprise, it is necessary to analyze profitability indicators - the relative characteristics of financial results and the efficiency of the enterprise as a whole.
The purpose of calculating profitability indicators is to assess the ability of an enterprise to generate income on funds and capital invested in current activities.
An enterprise is considered profitable if, as a result of the production and sale of products, it recovers its costs and makes a profit.
To assess profitability indicators, initial data from Form No. 2 of the financial statements “Report on Financial Results” is used:
- Profitability of core activities (total profitability; Rtotal) is the ratio of profit before tax to revenue from product sales, which shows the operating efficiency of the analyzed enterprise:
Rtotal = (Profit before tax / Revenue) × 100%.
- Profitability of production (Rproduction) is the ratio of gross profit to cost. Allows you to estimate the amount of profit received and the costs of achieving it:
Rproduct = (Gross profit / Cost) × 100%.
- Return on product (ROM) is the ratio of net profit to total cost. Shows how much profit was received per ruble of current costs:
ROM = (Net profit / Cost) × 100%.
- Return on sales (NRM) is the ratio of profit to revenue.
Return on sales is the final characteristic of the operation of an enterprise and characterizes the profitability of activities, the correctness of pricing, reflects the share of profit in sales revenue (what profit the enterprise receives from a ruble of sales, work performed, services rendered, i.e., turnover, products sold) and shows what amount of net profit does the enterprise receive from each ruble of products sold, how much money does it have left after covering the cost of production, paying interest on loans and paying taxes:
NPM = Sales Profit / Revenue × 100%.
Example 3
Let's calculate the profitability indicators of the enterprise (Table 2) and summarize the results of the analysis.
There are no standard values for profitability indicators; some experts even believe that any value exceeding “0” already indicates profitability.
Absolute indicators presented on the left side of the table. 2, they say that the profitability of the enterprise is insignificant in comparison with sales revenue due to the high cost of production.
__________________________
The financial results report indicates the total sales revenue and total costs of the enterprise. If the enterprise has high production and sales costs, a detailed analysis of the structure of the total cost is carried out and measures are developed to optimize costs.
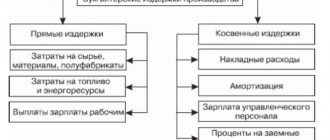
Effective methods to optimize costs as part of production costs:
1. Reduce costs for raw materials, materials and components - enter into contracts with manufacturers directly, bypassing intermediaries or reducing their number to a minimum in order to reduce the purchase cost of raw materials; purchase large quantities of materials - usually they provide a discount; independently produce components; purchase cheaper raw materials, etc.
2. Reduce labor costs - reduce the number of employees, reduce the level of wages, the labor intensity of manufacturing a unit of product, etc.
3. Reduce enterprise overhead costs. To do this, costs are classified according to the principle of significance and necessity. Expenses that cannot be avoided are left unchanged, and “unnecessary” expenses, the absence of which will not significantly affect the activities of the enterprise, are reduced to a minimum.
How to determine the final financial result?
Taking into account the financial results for ordinary and other activities, we figured it out. But how to determine the overall financial result for the enterprise as a whole? First, let's define what it consists of.
The final financial result includes:
- financial result obtained from ordinary activities;
- financial result identified from other activities;
- accrual of income tax.
The result of accounting for financial results for ordinary activities is reflected:
- Dt 90.9 Kt 99 - profit;
- Dt 99 Kt 90.9 - loss.
The balance of accounting for financial results for other activities is as follows:
- Dt 91.9 Kt 99 - profit on other operations is reflected;
- Dt 99 Kt 91.9 - loss received from other activities.
Income tax is required to be assessed and paid by Russian and foreign companies that operate within the territory of our country and apply the general tax regime. It is reflected in the following entry in the accounting accounts:
Dt 99 Kt 68.4 - income tax is charged, which is intended to be transferred to the budget system of the Russian Federation.
You can learn how to determine the amount of income tax from the publication “How to correctly calculate corporate income tax?”.
For the entire financial year, the balance of profits and losses in accounts 90 and 91, as well as accrued income tax, are accumulated in account 99. At the end of each year, the result of accounting for financial results is determined and final entries are made using account 84 “Retained earnings (uncovered loss)”:
- Dt 99 Kt 84 - net profit received.
- Dt 84 Kt 99 - the loss of the financial year is reflected.
Thus, account 99 is completely closed at the end of the year and cannot have a balance.
At the end of the year, all organizations transfer information from the 90th accounts to the financial results report. Let us remind you that by the end of 2022, fill out the information on an updated form. Read about what has changed in the form here.
ConsultantPlus experts told us how to correctly fill out a financial results report. Get trial access to K+ and learn how to fill out Form 2 for free.
You can download a sample of filling out a report in the new edition with comments on the design from K+ experts in the ConsultantPlus reference and legal system. To do this, get a free trial demo access to the system:
List of financial indicators
Company turnover dynamics
A financial indicator of the company's turnover dynamics shows that the company has customers and that they buy the company's products. The dynamics of the report indicator in terms of turnover is calculated by the ratio of the company’s current turnover to the indicator for the previous similar period. If the indicator is greater than one, this indicates that the company’s business is developing.
Order a consultation with an expert on analyzing financial results in 1C
Formula for calculating this financial indicator (D):
D=sales revenue for the current period/sales revenue for the previous similar period
Return on assets
The return on assets ratio will show us the company's ability to make a profit from its activities. It (Cr.a.) is calculated as follows:
Cr.a.=Net profit/Assets
Autonomy (financial independence) coefficient
This indicator reflects the share of assets that are secured by equity capital. The remaining assets reflect the level of debt burden. And the higher the financial independence ratio, the more likely it is that the company will pay off its debts with its own funds.
Kf.n.=Equity capital and reserves/Total assets
If this coefficient has a value of 0.5, and the company suddenly needs to pay off all current existing debt, it, in principle, will be able to pay for all debt obligations presented to it, but for this it will need to sell all its assets, including non-current ones. Thus, a coefficient value of 0.5 (that is, the amount of equity capital is totally equal to current liabilities) indicates a conditional threshold:
- if the coefficient is more than 0.5, and its growth dynamics are observed, then the financial stability of the organization is growing;
- and vice versa, if the coefficient is less than 0.5 and its decrease is observed, then the debt burden on the enterprise increases, thereby reducing its financial stability.
Accounting for the use of profits
Profit is a positive result of the company's activities as a whole. Every enterprise is interested in increasing it. But making a profit alone is not enough for the further development of the organization. Its rational and effective use is of great importance. Net profit is the profit remaining at the disposal of the enterprise after paying income tax. It is reflected in the credit of account 84 and is subject to further distribution.
Find out how to analyze a company’s net profit from our article “Procedure for analyzing a company’s net profit.”
The main directions of distribution of net profit:
- Creation of reserve capital. For joint-stock companies, its creation is a prerequisite; other enterprises can create it at their discretion:
Dt 84 Kt 82 - reserve capital was formed at the expense of net profit.
- Repayment of losses from previous years:
Dt 84 Kt 84 - the loss of previous years is repaid.
- Accrual and payment of dividends to company participants:
Dt 84 Kt 75 (70) - dividends are reflected.
Account 70 is used when the shareholders are employees of the enterprise.
Based on the results of the financial year, the enterprise may receive a loss, which is also reflected in account 84. It can be covered in several ways:
- Using additional capital:
Dt 83 Kt 84.
- At the expense of the amount of reserve capital that was created in previous reporting periods after the distribution of net profit:
Dt 82 Kt 84.
- Due to additionally attracted contributions from company participants:
Dt 75 (70) Kt 84.
Thus, the rational use of profits allows the enterprise to remain more sustainable in the future. Modern economists consider the creation of reserve capital to be one of the most effective ways to use net profit. It will help the company in the future to cover losses from its activities, which are possible in an unstable economic situation.
Analysis of the financial results of the organization's activities
The financial result of the financial year shows the effectiveness of the commercial activities of the enterprise. Timely and complete accounting of financial results is important from an economic point of view, as it allows you to obtain the most reliable data and conclusions. Analysis allows you to identify the weaknesses of the enterprise and find a more rational use of available resources. Analysis data can be used for current and strategic planning of the company's activities in the future.
The main purpose of analysis, as well as accounting for financial results, is to assess the state of the enterprise as a whole. Such data is necessary not only for the management of the enterprise, but also for the company specialists responsible for its further development. Basically, the analysis uses a deductive method, that is, a movement from general data of accounting for financial results to specific ones.
Accounting for financial results involves the preparation and submission of financial statements. Profit occupies one of the key places when carrying out analytical calculations. A distinction is made between the analysis of accounting and economic profits of an enterprise. The difference between them lies in the manner in which profit is determined.
The calculation of accounting profit is based on accounting data. It is this profit that we see in the income statement. Accounting profit recognizes only explicit costs for real and documented business transactions. When determining economic profit, experts also take into account implicit costs. Because of them, the difference between accounting and economic profit is formed. Implicit costs represent alternative resources or lost economic opportunities (benefits). For example, a company has a savings deposit with a credit institution. If it had additionally invested certain financial resources into it during the year, then the income on the deposit could have increased. The amount of possible, but not received interest on the deposit will be lost economic profit.
Each type of profit can be analyzed using basic techniques:
- Comparative analysis, which involves comparing the same indicators over similar periods of time, and also reveals deviations between them, up or down.
- Structural analysis aimed at calculating the structure of each indicator in the total weight of all data and the dynamics of its change.
- Factor analysis, which is used to determine the influence of each factor on the economic result and identify the relationships between them.
Each enterprise that is interested in further increasing profits must choose those analysis methods that best suit its specific activities and industry.
Formulas for calculating the main indicators that characterize the company’s activities can be found in the article “Basic financial ratios and formulas for their calculation.”
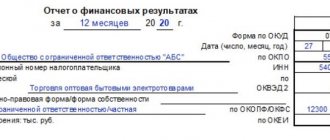
How to fill out the header of the financial results report
The header of the report contains information about the organization and the form itself.
- Reporting period. All organizations are required to submit Form No. 2 annually. In this case, indicate the period “12 months 2020”. But the owners of the company may decide that they need interim accounting reporting: quarterly or monthly. Such reports must be completed on a cumulative basis from the beginning of the year. For example, for quarterly delivery - for 3, 6, 9 and 12 months of 2022.
- OKUD report form. Starting with the report for 2020, indicate the form code 0710002 in accordance with the current edition of the Decree of the State Standard of the Russian Federation dated December 30, 1993 No. 299.
- Date the form was filled out.
- Full name of the organization and its TIN and OKPO codes.
- The main type of activity and its code. For the report for 2022, select codes from the updated OKVED-2 classifier.
- Organizational and legal form and its code according to OKOPF. For example, if you have a limited liability company, then use code 12300, and if you have a public joint stock company, use code 12247.
- Form of ownership and its OKFS code. For private property use code 16.
- Unit of measurement and its code according to OKEI. Until reporting for 2022, organizations could fill out Form No. 2 in thousands or millions of rubles. Starting in 2022, the right to choose will no longer exist. Even if you have a large company with billions of dollars in turnover, you still need to fill out Form 2 in thousand rubles. and indicate the OKEI code - 384.
Results
The financial result is the result of the financial activities of the organization. It shows how effective the company's activities were as a whole. Profit is a relative indicator of an organization's performance. It indicates a positive result of the activity. However, after conducting analytical procedures, other conclusions about the efficiency of the enterprise can be made.
Accounting for financial results for ordinary types of activities is carried out on account 90, for other types of activities - on account 91. The final financial result is determined on account 99 and consists of the balance of income and expenses for ordinary and other types of activities, accrued corporate income tax.
At the end of each year, account 84 reflects the amount of net profit or uncovered loss. Net profit is subject to distribution and must be used rationally from an economic point of view. The loss of the reporting period can be covered using additional and reserve capital, as well as by attracting additional contributions from company participants.
Currently, a large number of techniques for analyzing financial results are used.
They are carried out by different services and management levels of the enterprise. The analysis can be carried out on the basis of accounting or economic profit. Each type of analysis and accounting of financial results is closely related to each other. Without the final accounting data of financial results, it is impossible to carry out any type of analysis. You can find more complete information on the topic in ConsultantPlus. Free trial access to the system for 2 days.
Examples of calculating net profit
Based on the OFR data, calculate the state of emergency according to RAS :
- Gross profit (Revenue - Cost of sales)
- -Commercial and administrative expenses
- +Income from participation in other companies
- -Etc. expenses
- -Income tax
EBITDA and EBIT . Based on IFRS indicators, their calculation:
- Emergency
- +Income tax expenses
- -Reimbursed income tax
- +Extraordinary expenses
- -Extraordinary income
- +Paid %
- -% received
- =EBIT*
- +Depreciation charges for tangible and intangible assets
- -Revaluation of assets
*EBIT = line 2300 “Profit (loss) before tax” + line 2330 “Interest payable”.
Fig. 3 EBIT in OFR
Information on depreciation can be found in the balance sheet appendix – Notes 2. Fixed Assets.
Fig.4 Application form
It’s good when EBIT is positive, but this does not guarantee an emergency, because if an enterprise has a large debt obligation, the result of its activities may be a loss.
Fig.5 OIBDA
ROA (EBIT/all assets) - the return on assets (both own and borrowed) is determined by the ratio of private equity to all assets of the enterprise, using balance sheet data. The value of assets is taken as an annual average: data on assets at the beginning and end of the year/2.
ROE (PE/own assets) - unlike the previous one, it shows only equity, and therefore gives a more realistic assessment of profitability.
It can also be defined like this:
NI/Equity*100%
The gap between them may grow as credit flows increase. With an increase in the company's equity capital, ROE will decrease, with an increase in borrowed funds, it will increase, and, on the contrary, ROA will decrease. The coefficient can also be calculated by calculating the net income of NV. For effective analysis, it is necessary to study the dynamics of indicators over the years.